Standard Deviation Calculator
Use this free calculator to compute the sample standard deviation (s),population standard deviation (σ), sample standard variance (s2) and population standard variance (σ2) for the given data set.
Please input comma separated numbers below and click CALCULATE.
When you are a statistics student, one of the first concepts that you will learn is the standard deviation. So, before we explain to you how you can easily use our free standard deviation calculator, we believe that it is always better to start by understand all the underlying concepts. In this case, it is important to know what the standard deviation is in the first place.
What Is The Standard Deviation?
Simply put, the standard deviation is a measure of dispersion or variation between values in a set of data. Notice that in statistics, the standard deviation calculator is usually denoted as σ.
One of the things that you need to understand is the interpretation of the standard deviation that you get. So,
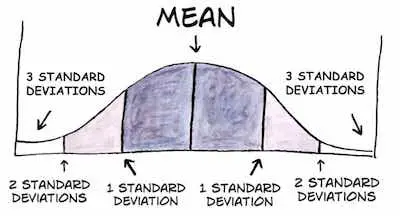
- When you have a low standard deviation, this means that the data points are closer to the mean or the expected value which is denoted by μ.
- When you have a high standard deviation, this means that the data points are far away from the mean which means that there is a wider range of values.
In case you are wondering about the reason why you need to learn what the standard deviation is and why you need to know how to calculate it, then you should keep in mind that there are many different situations in which the standard deviation is used.
The truth is that besides the fact that the standard deviation expresses the population variability, this measure is also used to measure statistical results such as the margin of error. When you need to use the standard deviation for this latter purpose, then you need to know that it is called the standard error of the mean or the standard error of the estimate in what concerns to the mean.
Use this calculator to determine the mean.
The Difference Between Sample And Population Standard Deviation
One of the things that we keep watching statistics students do is that they tend to confuse sample and population standard deviation. But they are not the only ones. The reality is that this is also very common among business owners.
In case you are a business owner, then you know that you need to be constantly figuring out what your current customers want as well as what your potential customers may need and be looking for. As you know, there are many different ways you can use to trace data. After all, you can use interviews, surveys, polls, quizzes, and you can even use historical research. However, when you need to put all this data together, ou will probably use the standard deviation.
If you remember from what we said above, the standard deviation is the measurement of spread in a specific data set. Therefore, it can be used to help you choose the best option among the many possibilities that you have. The difference between sample and population standard deviation is the data set.
Lear more about confidence intervals.
Population Standard Deviation
Simply put, the population standard deviation is used when you can measure the entire population. It is often denoted as σ and it is the square root of the variance of a given data set.
So, when you can find all members of the population, you can simply use the following formula to determine the standard deviation of the entire population:
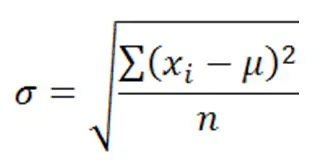
Where:
xi is an individual value
μ is the mean/expected value
n is the total number of values
In case you don’t like or don’t know how to work with summation notation, then the above equation can seem pretty difficult. However, we want to assure you that it is not. After all, you just need to address it through its individual components. The i=1 in the summation indicates the starting index, i.e. for the data set 1, 3, 4, 7, 8, i=1 would be 1, i=2 would be 3, and so on. Hence the summation notation simply means to perform the operation of (xi – μ2) on each value through n, which in this case is 5 since there are 5 values in this data set.
Example:
μ = (1+3+4+7+8) / 5 = 4.6
σ = √[(1 – 4.6)2 + (3 – 4.6)2 + … + (8 – 4.6)2)]/5
σ = √(12.96 + 2.56 + 0.36 + 5.76 + 11.56)/5 = 2.577
Here’s all you need to know about the F test.
Sample Standard Deviation
One of the things that you need to keep in mind is that, in most cases, it’s simply impossible to sample every member within a population. So, as you can imagine, you won’t be able to use the formula we showed you above. Instead, you will need to use the standard deviation that can be measured by a random sample of the population being studied.
Notice that the sample standard deviation is usually denoted by s but there are many different variations of this formula. So, we believe that the one that best express your needs is the corrected sample standard deviation and it is simply a corrected version of the equation obtained from modifying the population standard deviation equation by using the sample size as the size of the population, which removes some of the bias in the equation.
One of the things that you need to keep in mind is that the unbiased estimation of standard deviation is highly involved and varies depending on the distribution. This is why we believe that the corrected sample standard deviation is the most commonly used estimator for population standard deviation, and is generally referred to as simply the “sample standard deviation.” It is a much better estimate than its uncorrected version, but still has significant bias for small sample sizes (N<10).
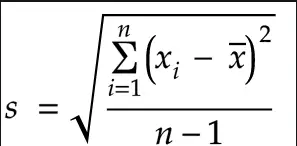
Where
xi is one sample value
x̄ is the sample mean
n is the sample size
Understanding the F statistic.
When To Use Sample Or Population?
This is a very important and common question a lot of business owners have. The truth is that when you are looking to measure the reactions of your current customers or their opinions, then you should use the population standard deviation. After all, this is a more quantifiable number. On the other hand, when you are looking to know or experimenting new ways to attract new customers, then you should use a sample deviation. After all, this way, you will be able to include many different variables such as geographic location, age, and gender.
Using Our Standard Deviation Calculator
Now that you already have a better understanding about the standard deviation as well as when to use the population standard deviation and the sample standard deviation, it is time to check our free and easy standard deviation calculator that you can do to do your calculations or to confirm your results.
When you are trying to know how to calculate standard deviation, all you need to keep in mind is that you just need to fill the blank space with your data set. As soon as you add it to the blank field, you need to click on the Calculate button to retrieve your results.
With our standard deviation calculator, you will be able to know the sample standard deviation, the variance (sample standard), the population standard deviation, and the variance (population standard).
As you can see, with our calculator, you will be able to determine all the values that you are looking for.
How To Calculate Standard Deviation By Hand
As we already mentioned, while you can definitely use our calculator, it is always better to know how to calculate standard deviation by hand as well.
So, when you want to calculate standard deviation, you just need to follow the next steps:
Step #1: Calculate the mean of your data set.
Step #2: Subtract the mean from each of the data values and list the differences.
Step #3: Square each of the differences from the previous step and make a list of the squares. This means that you will need to multiply each number by itself.
It’s important to note that you should be careful when you are dealing with negatives. Remember that a negative times a negative makes a positive.
Step #4: Add the squares from the previous step together.
Step #5: Subtract one from the number of data values you started with.
Step #6: Divide the sum from step four by the number from step five.
Step #7: Take the square root of the number from the previous step. This is the standard deviation. One of the things that you need to keep in mind is that you should use significant figures when rounding your answer.
A Practical Example

Now that you already know the steps that you need to follow to calculate the standard deviation, let’s see a practical example so that you can fully understand the entire process.
Suppose you’re given the data set 1,2,2,4,6 and you wan to calculate the standard deviation:
Step #1: Calculate the mean of your data set.
The mean of the data is:
Mean = (1+2+2+4+6) / 5
Mean = 15/5
Mean = 3
Step #2: Subtract the mean from each of the data values and list the differences.Subtract 3 from each of the values 1,2,2,4,6:
1-3 = -2
2-3 = -1
2-3 = -1
4-3 = 1
6-3 = 3
Your list of differences is -2,-1,-1,1,3
Step #3: Square each of the differences from the previous step and make a list of the squares. You need to square each of the numbers -2,-1,-1,1,3:
(-2)^2 = 4
(-1)^2 = 1
(-1)^2 = 1
1^2 = 1
3^2 = 9
Your list of squares is 4,1,1,1,9
Step #4: Add the squares from the previous step together.
You need to add:
4+1+1+1+9=16
Step #5: Subtract one from the number of data values you started with. You began this process with five data values. One less than this is:
5-1 = 4
Learn more about normality tests for statistical analysis.
Step #6: Divide the sum from step four by the number from step five. The sum was 16, and the number from the previous step was 4. You divide these two numbers:
16 / 4 = 4
Step #7: Take the square root of the number from the previous step. This is the standard deviation.
Your standard deviation is the square root of 4, which is 2.
Discover more about standard deviation.
Applications Of Standard Deviation
The standard deviation is very used in industrial and experimental settings to test models against real-world data.
An example of this in terms of industrial applications is the quality control for some product. The standard deviation can be used to calculate a minimum and maximum value within which some aspect of the product should fall some high percentage of the time. In cases where values fall outside the calculated range, it may be necessary to make changes to the production process to ensure quality control.
Lear more about normal distribution.
Another example where it is possible to see the use of standard deviation is to determine differences in regional climate.
Imagine two cities, one on the coast and one deep inland, that have the same mean temperature of 75°F. While this may prompt the belief that the temperatures of these two cities are virtually the same, the reality could be masked if only the mean is addressed and the standard deviation ignored.
The reality is that coastal cities tend to have far more stable temperatures due to regulation by large bodies of water, since water has a higher heat capacity than land. Basically, this makes water far less susceptible to changes in temperature, and coastal areas remain warmer in winter, and cooler in summer due to the amount of energy required to change the temperature of water. Hence, while the coastal city may have temperature ranges between 60°F and 85°F over a given period of time to result in a mean of 75°F, an inland city could have temperatures ranging from 30°F to 110°F to result in the same mean.
Another area in which standard deviation is largely used is finance, where it is often used to measure the associated risk in price fluctuations of some asset or portfolio of assets. The use of standard deviation in these cases provides an estimate of the uncertainty of future returns on a given investment. For example, in comparing stock A that has an average return of 7% with a standard deviation of 10% against stock B, that has the same average return but a standard deviation of 50%, the first stock would clearly be the safer option, since standard deviation of stock B is significantly larger, for the exact same return. That is not to say that stock A is definitively a better investment option in this scenario, since standard deviation can skew the mean in either direction. While Stock A has a higher probability of an average return closer to 7%, Stock B can potentially provide a significantly larger return (or loss).