Student t-Value Calculator
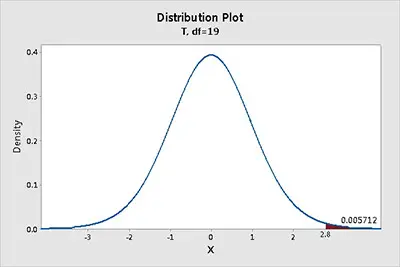
Use this free calculator to compute the Student t-value for a given probability (P) and degrees of freedom (DF). This calculator will return both one-tailed (right tail) and two tailed probabilities.
Please enter degrees of freedom and probability level in the required fields and click CALCULATE.
What Is A T Test?
Simply put, a t test allows you to know how significant the differences between groups are. This means that with this test, you will be able to determine of the differences that are measured in terms of averages or means could have occurred by chance.
Here’s a simple example. Let’s imagine that you have a cold and you want to try out a naturopathic remedy. So, you take notice and the cold lasts a couple of days. The next time you get a cold, you will then buy an over-the-counter pharmaceutical and the cold lasts one week. So, you decide to ask your friends about what they do when they have a cold. And you just discover that they usually take a homeopathic remedy and that their colds last, on average, 3 days. So, your goal with all this is to determine if these results are repeatable. And this is what a t test can deliver. And all you need to do is to add the data to the above t value calculator and get your t value.
But let’s take a look at a different example. Let’s now imagine that a drug company wants to test a new cancer drug. As you know, the approval of any drug needs to pass rigorous tests and processes imposed by the FDA. And one of them is the clinical trial. So, the company will need to find a group o volunteers who are willing to try out the drug. However, as you probably already know, there is always a control group which is a group of people that instead of taking the new drug take a placebo.
Just try out our free t statistic calculator and see how it will be easier to get the results.
Let’s imagine that at the end of the clinical trial, the control group shows an average life expectancy of more than 5 years. In what concerns the group who took the drug, they show an average life expectancy of 6 years. So, while most people would immediately conclude that the drug should go to the market, it is important to be sure. And you don’t know if these results can be repeated with a different group of people. So, you would need to use the Student’s t test. In case you are looking to do these calculations, you can simply use the t value calculator above.
Interpreting The T Score
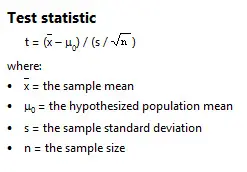
As you already know, the t score is simply the ratio between the difference between two groups and the difference within groups.
So, we can say that:
- The larger the t score, the more different the groups are.
- The smaller the t score, the more similar the groups are.
For example, let’s say that you get a t score of 3. This means that the groups are 3 times as different from each other as they are within each other. So, when you conduct a t test, the bigger the t value that you get, the more likely it will be for the results to repeat.
Make sure to use our free t statistic calculator above.
However, you really don’t know how big the t score needs to be to be likely for the results to repeat. Therefore, you need to know the p-value or the probability value as it is also known.