5 Ways To Detect Multicollinearity
One topic that tends to cause a lot of apprehension on statistics students is multicollinearity.
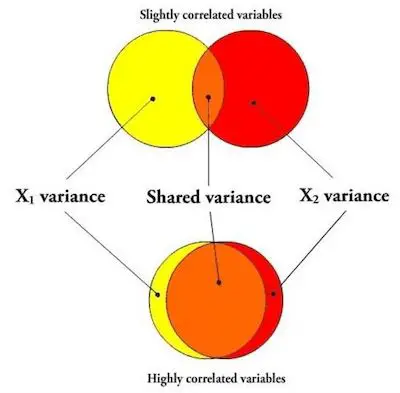
In case you don’t know or don’t remember what multicollinearity is, then you just need to know that multicollinearity occurs when 2 or more predictor variables overlap so much in what they are measuring that their effects cannot be distinguished. So, when you created a model to estimate the unique effects of these variables, then you can say that it goes wonky.
One aspect that you need to always keep in mind is that multicollinearity may affect any regression model with more than one predictor.
A Quick Example
Let’s say that you were trying to understand the different effects that temperature and altitude have on the growth of specific species of mountain trees.
As you know, both temperature and altitude are different concepts. Nevertheless, the mean temperature is so correlated with the altitude at which the tree is growing that you simply can’t separate both effects. While this seems pretty obvious, the reality is that it isn’t easy to prove that the model is wonky due to multicollinearity.
Learn how to calculate standard error online.
One of the best and most used ways to detect multicollinearity is based on the bivariate correlation between 2 predictor variables. In case it is above 0.7, this means that you have multicollinearity. While you can easily understand that a high correlation between two predictors is an indicator of multicollinearity, there are two problems with treating this rule of thumb as a rule:
- How high that correlation has to be before you’re finding inflated variances depends on the sample size. There is no one good cut off number.
- It’s possible that while no two variables are highly correlated, three or more together are multicollinear. While this seems strange or weird, it happens.
So, in these cases, you’ll completely miss the multicollinearity in that situation if you’re just looking at bivariate correlations.
Discover how to use our standard error online calculator.
5 Ways to Detect Multicollinearity
#1: The Overall Model Is Significant But Th Coefficients Aren’t:
Remember that a p-value for a coefficient tests whether the unique effect of that predictor on Y is zero. If all predictors overlap in what they measure, there is little unique effect, even if the predictors as a group have an effect on Y.
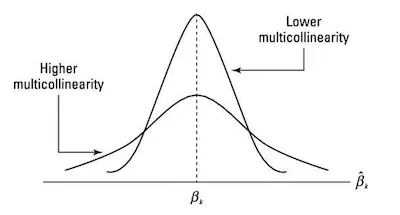
#2: Very High Standard Errors For Regression Coefficients:
When standard errors are orders of magnitude higher than their coefficients, that’s an indicator.
#3: Coefficients On Different Samples Are Very Different:
When you have a large sample, then simply split it into half and run the same model on both halves. Wildly different coefficients in the two models could be a sign of multicollinearity.
#4: Coefficients Have Different Signs From What You Were Expecting:
Notice that not all effects opposite to the theory indicate a problem with the model. Nevertheless, it could be multicollinearity and warrants taking a second look at other indicators.
Check out this easiest standard error calculator.
#5: Big Changs In Coefficients When You Add Predictors:
When your predictors are independent, their coefficients will be maintained no matter if you add one or remove one. So, this may mean multicollinearity.