Chi square calculator
What is the chi-square test?
Before you use our chi square calculator we want you to be informed about the chi-square test. It is a statistical hypothesis test used to see if a data set fits a particular distribution. Calculating chi-square can be done in two ways. One method is by finding the expected frequencies and the other way is by calculation of degrees of freedom and critical value.
The hypotheses for this research are:
Null Hypothesis: The distributions of the data set fit a normal distribution.
Alternative Hypothesis: The distributions of the data set do not fit a normal distribution.
The chi-square test is used to test whether or not there is a significant difference between two types of categorical variables in sample size, and it gives a value for each variable type. This test is used to find whether the expected frequency in each category of one variable matches with the observed frequency in a different variable, and if so, which category is more probable.
Calculating chi-square using a total number of frequencies:
1) Find the degrees of freedom for this research question by taking (r-1)(c-1), where r is for the number of rows of data and c is for the number of columns. In this case df = (4-1)(3-1)= 4
Click here to use chi square calculator for free
2) Find the critical value by going to an online table or a more comprehensive chart with degrees of freedom under “5” and find the closest chi-square value, or, alternatively use online software to calculate the critical value.
3) Calculate chi-square using the total number of frequencies by using the formula where Oi is observed items in category i, Ei is the expected frequency of category i. This is then compared to what standard deviation they are from one another, if they are far enough away then it is considered significant.
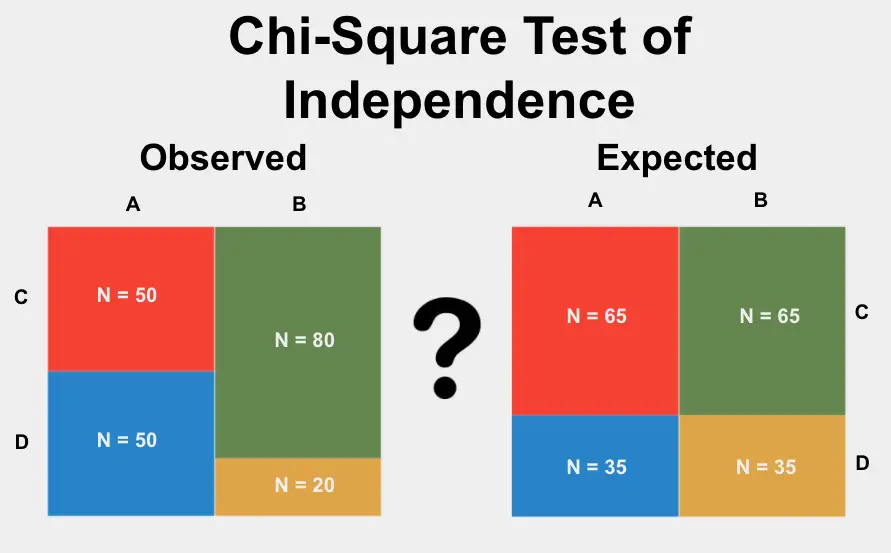
Calculating chi-square using observed and expected frequencies:
1) Find the degrees of freedom for this research question by taking (r-1)(c-1), where r is for the number of rows of data and c is for the number of columns. In this case df = (4-1)(3-1)= 4
2) Find the critical value by going to an online table or a more comprehensive chart with degrees of freedom under “4” and find the closest chi-square value, or, alternatively use online software to calculate the critical value.
3) Calculate chi-square using observed and expected frequencies by using the formula where Oi is observed items in category i, Ei is the expected frequency of category i. This then needs to be compared to what standard deviation they are from one another, if they are far enough away then it is considered significant.

Click here to use our T Distribution Table
Non-parametric methods like the chi-square test help researchers with social science data sets due to the fact that the variables can have more than two outcomes. It is a great statistic for categorical variables because it calculates the probabilities of both variables compared to each other and uses this to see how significant they are.
An example used for a chi-square test is comparing smoking habits between men and women using gender as a variable with two possible outcomes:
Male and female. Using a chi-square test, the researcher would look at how many men smoke compared to women, and then see if there’s a correlation between gender and smoking habits, which is what the alternative hypothesis states.
Since technology has advanced with programs such as SPSS making it easier for researchers to calculate data sets.