How To Conduct A T Test In Excel
As you probably already know, a t test can be very useful in statistics. After all, this test allows you to know if there is a difference between the means. In case you don’t know, or simply don’t remember, the bigger the t value, the bigger the difference between the two samples.
Use the best statistic tables.
While you can do a t test by hand, you should know how to do a t test in excel. After all, this can save you a lot of time. However, you need to understand that when you are working with excel, you can actually make three different t tests:
- the paired two sample for means
- the two-sample assuming equal variances
- the two-sample assuming unequal variances
So, let’s discover how to do a t test in excel.

Let’s say that you just collected the data and that you organized the data in your excel spreadsheet. The range A1:A21 contains the first set of values and the B1:B21 contains the second set f values.
Lear more about the two sample t test.
Step #1: Make sure that you choose the “Data Analytics” and then “Data”.
Step #2: Now, you should be able to see the Data Analysis dialog box. So, all you need to do is to pick the t test that you want to make from the Analysis Tools list.
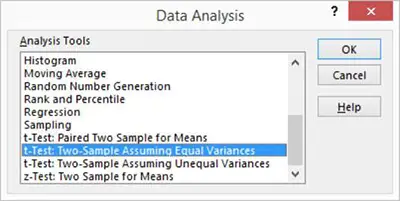
As you can see, you’ll be able to choose between:
- the t-Test: Paired Two-Sample For Means: This is the one that you should choose when you want to make a paired two-sample t test.
- the t-Test: Two-Sample Assuming Equal Variances: This is the t test that you should choose when you believe that both samples’ means are equal.
- the t-Test: Two-Sample Assuming Unequal Variances: This is the t test that you need to choose when you want to do a two-sample t test and you believe that the two-sample variances are different.
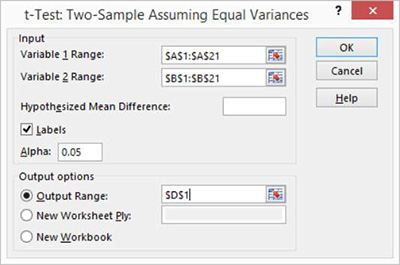
Step #3: As soon as you decide about the test to perform, just click ok. Let’s say that you chose the second t test. You will then see the following dialog:
While this is just an example, the other dialog windows are very similar so you shouldn’t have any problems filling them in.
Discover everything you need to know about the unpaired t test.
Step #4: Adding The Inputs:
As you can see, the first fields that you need to fill are the “Variable 1 Range” and the “Variable 2 Range”. All you need to do is to fill in with the ranges that you have for the data. In this case, in the first field you will need to add $A$1:$A$21 and in the second field, $B$1:$B$21. However, to make it easier, you can simply drag the data for the appropriate field directly from the excel spreadsheet.
Check out this simple paired t test example.
The next field that you need to fill is the “Hypothesized Mean Difference”. In this box, you will need to specify whether you believe the means are equal or different. The way that you have to do this is very simple. In case you believe that the means are the same, you just need to add zero (0) in the text box. On the other hand, if you believe they are different, you should add the mean difference.
Next, you need to add the Alpha. This refers to the confidence level that you are using in your t test calculation. The confidence level always varies between 0 and 1. So, you will need to add your own. Please notice that if you don’t add any, the default confidence level will be applied – which is equal to 0.05, which is the same to say that you have a 5% confidence level.
The last area that you need to fill regards to the “Output Options”. And these are simply the place where you want your results to be seen. If you want the results to be displayed in a specific cell, you just need to add it right beside the “Output Range”. Or you can choose one of the other options.
Step #5: Click OK.
As soon as you click OK, the results of the t test will be displayed according to what you specified.