Advantages And Pitfalls Of Using The Z Score
There’s no question that using the z score can be very helpful in certain situations. However, its use may also lead to pitfalls that you need to know about. However, before we start, we believe that it is important to remind you about what actually ar z scores.
Discover the best statistics calculators.
What Are Z Scores?
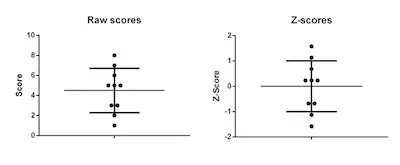
Simply put, z scores are a way that you have that allows you to standardize a score in respect to other scores in the group. As you already know, in order to determine the z score, you need to know both the mean and the standard deviation of the group.
So, we can then state that a z score expresses a specific score in terms of how many standard deviations it is away from the mean.
Looking to know more about the z score table?
Notice that when you convert a raw score into a z score, you are ultimately expressing that score on a z score scale which always has a mean of zero and a standard deviation of one. So, to sum up, when you calculate the z score you are redefining each raw score in terms of how far away it is from the group mean.
Now that you are already reminded about what a score is, it’s time to check out the advantages and pitfalls of using the z score.
Advantages Of Using The Z Score
As you know, you can’t always use the z score. However, when it is possible, using it can bring different advantages:
#1: Clarity:
One of the main advantages of using the z score is the fact that you can see and understand the relationship between the raw score and the distribution of scores much clearer. So, this means that it is possible to get an idea of how good or bad a score is relative to the entire group.
Discover more about the z table.
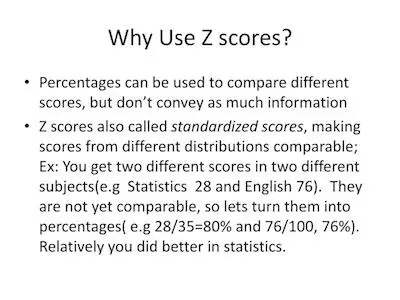
#2: Comparison:
Another great advantage of using the z score is related to the fact that you can easily compare scores that are measured on different scales.
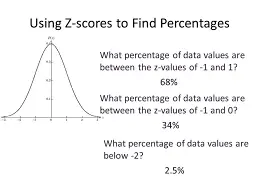
#3: The Area Under The Curve:
If you think about it, you already know many different properties of the normal distribution. So, by converting to a normal distribution of z scores, you will be able to discover how many scores actually fall between certain limits. So, this means that you can then calculate the probability of a specific score occur.
#4: The Area Between The Mean And Z:
Ultimately, this specific area of the table tells you the proportion of scores that are between the mean and a specific z score. Notice that this proportion is the area under the curve between those points.
#5: Area Beyond Z:
This part of the table tells you the proportion of scores that are greater than a specific z score.
Pitfalls Of Using The Z Score
#1: When you calculate the z score from raw scores, you may end up losing the meaningfulness of these raw scores.
Understanding the z score table normal distribution.
#2: Since you need to know the standard deviations to calculate the z score, you may also lose the meaning standard scores.
#3: When you are using the z score, you may end up magnifying small differences.
#4: Linear transformations require interval data and some of the data that you use may bot be interval level.