Basic Statistics Formulas You Need To Understand
When you are studying statistics, you need to know that there are a lot of different formulas that you need not only to know but also to understand. So, we decided to gather here the basic statistics formulas that you should definitely understand. After all, they are the base of everything that you can do related to statistics but also related to probabilities.
Discover the best statistical calculators online that can give you a hand.
Our main goal to show you these basic statistic formulas it to allow you to model, analyze, and test different statistical experiments and surveys.
While you probably already heard about most of the probability and statistics formulas we are about to mention, it’s also important to remember them and put them into context.
Here are some of the basic statistic formulas you need to understand:
#1: Population Mean:
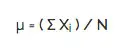
Where,
μ – population mean
Σ Xi – sum of all scores that are present in the population
N – the total number of cases or individuals in the population
The population mean is simply the average score of the population on a given variable.
#2: Population Standard Deviation
![]()
Where,
σ – population standard deviation
sqrt – square root
Σ ( Xi – μ )2 – sum of the squared deviations of the scores from the population mean
The population standard deviation allows you to measure the variability or spread of the scores on a specific variable.
#3: Population Variance:
![]()
The population variance is the square of the standard deviation of the population.
#4: Sample Mean:
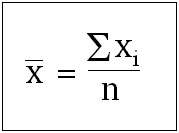
where,
Xi – are the scores of the sample
n – the total number of observations in the sample
The sample mean is the average of the sample on a given variable.
#5: Sample Standard Deviation:
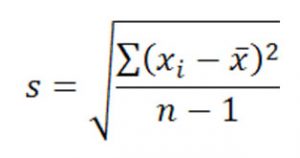
where,
Xi – the scores of the sample
X_bar – sample mean
n – the total number of observations in the sample
The sample standard deviation is a measure of the spread or variability of the scores in the sample that you are analyzing, for each given variable.
#6: Sample Variance:
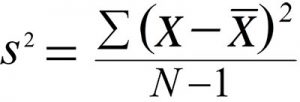
Simply put, the sample variance is the square of the sample standard deviation.
#7: Chi Squared Test:
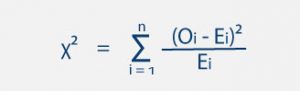
Where,
Oi – observed frequencies
Ei – expected frequencies
You can either calculate the chi square value by hand or you can use our free Critical Chi Square Value Calculator.
#8: Standard Or Z-Score:
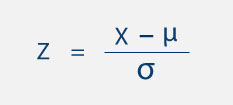
Where,
X – member element of the group
μ – mean of expectation
σ – standard deviation
#9: Covariance Of X & Y:
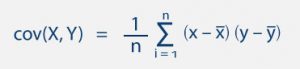
Cov(X,Y) – covariance between the X and Y variables
x – member of the X variable
y – member of the Y variable
x_bar – mean of the X variable
y_bar – mean of the Y variable
n – number of members
And here are some of the probability formulas you also need to understand:
#1: Probability Of An Event A:
![]()
The probability of an event tells you how likely it is for it to happen.
Check out our binomial probability calculator.
When you have two different events A and B:
P(A) = n(A) / n
P(B) = n(B) / n
![]()
When you are dealing with mutually exclusive events, then:
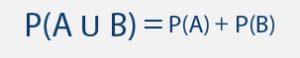
When you are dealing with non-mutual events, then,
![]()
For conditional probability:
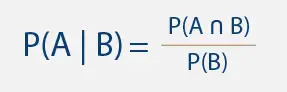
While there are many more probability and statistics formulas, the truth is that we just showed you the most basic statistics formulas and probability formulas that you need to know about. As you get to know more concepts, you can then move to more complicated statistics terms and formulas as well as to other tests and models. Nevertheless, we believe that these are now enough for you to get a grasp of statistics and probabilities formulas.