In statistics, it’s crucial to look at your sample closely. After all, you want to ensure that it represents the population well, that it has a regular pattern, and that the data you have is precise and not vague.
Discover the best statistics calculators online.
So, when you want to answer these questions, you need to take a look at the measures of central tendency and the measures of dispersion.
Measures Of Dispersion Explained
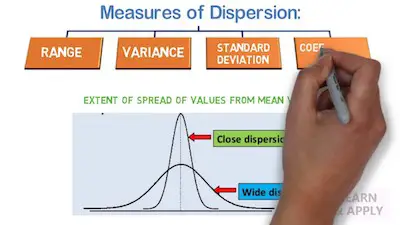
#1: Range:
Simply put, the range of your data gives you good insight into all the measurements that are covered. Unlike the median, which reveals the middle value only, the range gives you an idea about the size of your measurements.
One of the best things about the range is that it is very simple to calculate. After all, it is merely the greatest measurement minus the lowest measurement. It allows you to see the numeric distance covered by the data.
In addition to this, when compared to the mean, median, and mode, the range also lets you identify outliers. Outliers are values that are very high or low and far from the mean, which is the general model of the data.
Check out our mean, median, mode, and range calculator.
#2: Interquartile Range:
The interquartile range gives you a great picture of the data.
Simply put, your data is divided into four sections: Q1, Q2, Q3, and Q4.
Q1 represents the range from the lowest value to the median value of the first half of the data. Q2 is the range from the median of the first half of the data to the median of the entire data set. Q3 is the range from the median of the data set to the median value of the second half of the data set. Q4 is the range from the median of the second half of the data set to the greatest value. The interquartile range is Q3 – Q2.
The sizes of the interquartile ranges give you insight into the variability of the data set. Ideally, they would all be equal or close to equal. If they vary a lot, then your data may be skewed.
Understanding the Chi-square test of independence rule of thumb: n>5.
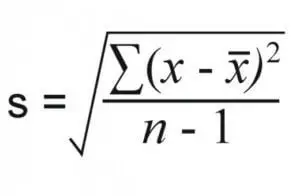
#3: Standard Deviation:
The standard deviation is one of the measures of dispersion that is more commonly used. After all, it’s a great way to get a sense of the variability of the data. It is a measure of the proportions of the data set. It is represented by s for a sample, or σ for a population.
Simply put, the standard deviation gives you a sense of how the actual values of the data set vary from the mean. A high standard deviation means that the data set varies a lot, but a low standard deviation means that the data do not vary very much. the smaller the standard deviation, the better.
The standard deviation of a sample is calculated by:
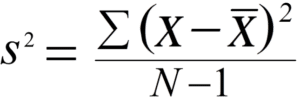
#4: Variance:
In essence, variance is very similar to standard deviation. You can easily calculate one from another.
How to take an interaction out of a model.
Simply put, the variance is a more precise measure of how precise your data is. It is represented by s2 for a sample and σ2 for a population.
If you know the standard deviation of the data, then the variance is easily calculated as the square of the standard deviation, for both the sample and the population. If you do not know the standard deviation, then the formal formula is: