A Comprehensive Exploration with Detailed Examples
Life is a series of unpredictable events, each carrying its own set of probabilities. Whether you’re contemplating the likelihood of rain affecting your weekend plans or analyzing the outcomes of a card game, you’re unknowingly navigating the waters of probability. One concept that reigns supreme in this realm is the ‘probability distribution.’ In this comprehensive exploration, we’ll demystify this cornerstone of statistics, amplifying our understanding through in-depth examples.
Check Out Our T-Statistic and Degrees of Freedom Calculator
Demystifying Probability Distribution
When we discuss probability distribution, we’re essentially referring to a mathematical function that gives the probabilities of occurrence of different outcomes for an experiment. In simpler terms, it’s a blueprint that lays out the likelihood of each potential outcome of a random process. It ensures that the combined probabilities of all these outcomes total to 1, offering a holistic view of all possibilities.
Broad Categories of Probability Distributions
Probability distributions don’t adhere to a one-size-fits-all model. Depending on the nature of outcomes, they can be primarily bucketed into:
- Discrete Probability Distribution: Relevant for scenarios with distinct, separate, countable outcomes. Think of individual outcomes, like the faces of a dice.
- Continuous Probability Distribution: Applicable for scenarios with a range of outcomes, where results can lie anywhere within a given continuum. Measures such as the weight or height of individuals typically fall here.
Diving into the Heart of Examples
Discrete Probability Distribution: Rolling a Dice
Let’s take the quintessential example of rolling a standard six-sided dice. Each face, from 1 to 6, has an identical probability of landing face-up. This probability stands at 1/6 or roughly 16.67%. In the realm of discrete distribution, the probability breakdown would look like:
– P(1) = 1/6
– P(2) = 1/6
– … and the pattern continues for each face.
Should you decide to graphically represent this, you’d notice each outcome shares an equal height, highlighting the essence of a uniform distribution.
Continuous Probability Distribution: Evaluating Adult Heights
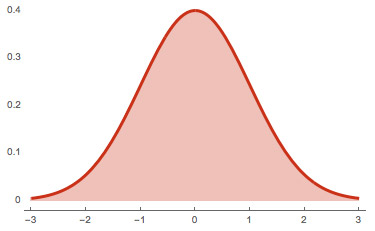
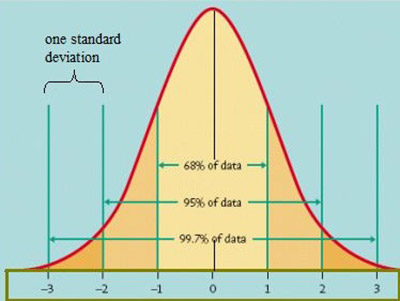
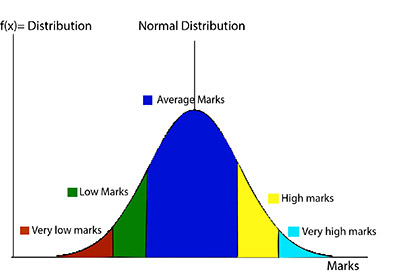
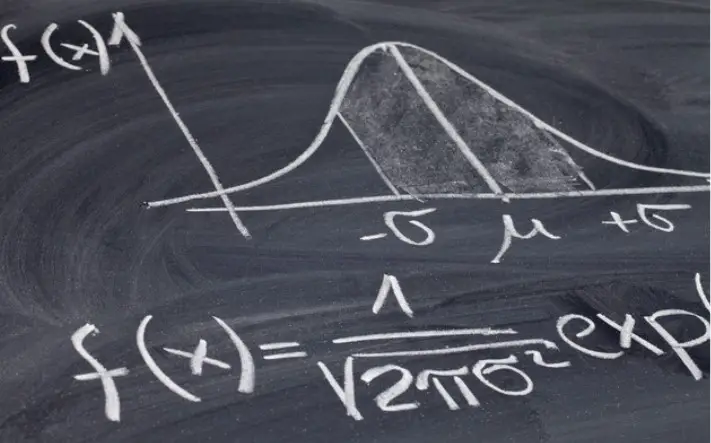
Venture into a thought experiment where you’re measuring the height of all adult females in a vast city. Given the intricacies of human genetics and environmental factors, it’s improbable for a large number to share the exact height down to the millimeter. This scenario is tailor-made for a continuous probability distribution. You might end up with a graph resembling a bell curve, a representation of the renowned normal distribution. In such instances, pinpointing the probability of a precise height (let’s say, 167.54 cm) would be zero. However, evaluating the likelihood within a specific range (like between 160 cm and 170 cm) offers a non-zero probability.
Spotlight on Renowned Probability Distributions
Several probability distributions have carved out their niche, owing to their paramount importance in various applications:
- Binomial Distribution: This examines the number of successes across a fixed set of Bernoulli trials. Imagine assessing the odds of flipping 4 tails in 7 coin tosses.
- Poisson Distribution: This is the go-to when modeling the frequency of events within specific intervals. An example could be gauging the number of customer service calls a company receives in an hour.
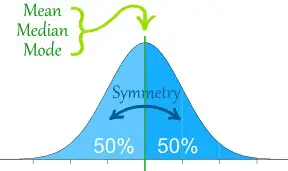
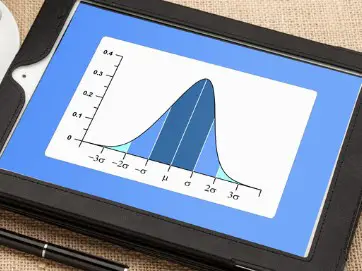
- Normal Distribution: The iconic bell curve, where data clusters around the average. A classic example is how human IQ scores across a large population distribute.
Try Out Various Statistical Calculators
The Pervading Relevance of Probability Distributions
Far from being merely theoretical constructs, probability distributions are entrenched in diverse fields:
- Finance: Stock market aficionados rely on them for pricing options and evaluating market volatilities.
- Scientific Endeavors: Whether it’s astronomy or zoology, researchers harness distributions to decipher patterns and predict occurrences.
- Corporate Realm: Enterprises tap into these distributions for sales forecasts, demand estimations, and other pivotal metrics.
Summary
Probability distributions are more than just mathematical concepts; they’re potent tools that offer lenses to decode the randomness enveloping our world. By grasping their intricacies, we arm ourselves with the ability to make nuanced predictions, deduce hidden patterns, and ultimately, craft informed strategies. From the simple toss of a coin to the complexities of global market trends, the footprints of probability distributions are omnipresent, asserting their undeniable significance.
