One of the things that you may not know is that statistical errors tend to be quite common. The reality is that many of the statistical procedures that you see published such as analysis of variance, t tests, regressions, and correlations tend to assume that the data follows a Gaussian distribution also known as normal distribution. However, when you do this and when you are looking to build reference intervals for variables, this can cause some problems.

Check out our free statistical calculators.
One of the things that you always need to keep in mind is that normality tests should be taken seriously or your conclusions may be affected.
While when you are using large sample sizes such as more than 30 or 40 there shouldn’t be major problems. After all, the violation of normality can be fought using paramedic procedures. The reality is that when you have hundreds of observations, you can simply ignore the distribution of the data.
Using Visual Methods
When you are trying to check the normality of the data, you can do a visual inspection. However, you need to know that this method is not very reliable and it really doesn’t guarantee that you are dealing with a normal distribution.
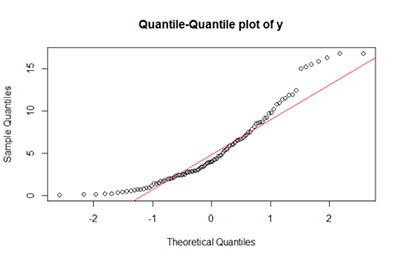
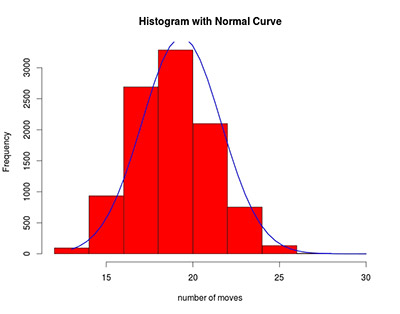
There are many different methods that you can see to determine if the data is distributed normally. These include quantile-quantile plots, probability-probability plots, boxplots, stem-and-leaf plots, frequency distribution or histogram, among others. This will allow you to see if the data forms the bell curve or not.
Learn the basic statistic formulas that you need to understand.
Normality Tests
Normality tests can also be used to determine if the data is normally distributed. It is often seen as a supplementary approach to the graphics used under the visual methods.
There are many different normality tests that you can perform. The most important ones include:
– Cramer-von Mises test
– Lilliefors corrected K-S test
– D’Agostino-Pearson omnibus test
– Kolmogorov-Smirnov (K-S) test
– Jarque-Bera test
– Anderson-Darling test
– Anscombe-Glynn kurtosis test
– Shapiro-Wilk test
– D’Agostino skewness test
These are the best introductory statistics books.
These normality tests usually compare the scores in the sample to a normally distributed set of data with the same standard deviation and the same mean.
In this case, the null hypothesis will always be “sample distribution is normal”. In case the test is significant, then you will be able to conclude that the distribution is non-normal.
Check out our paramedic calculator.
When you have small sample sizes, you need to understand that normality tests may not be very useful. The reality is that normality tests tend to almost always to accept the null hypothesis.
On the other hand, when you have large sample sizes, it’s a good idea to use normality tests. The reality is that you should get a significant result even when the deviation is small.
Conclusion
When you are looking to determine the normality assumption, you should take into account the use of paramedic statistical tests. One of the tests that was usually used to access normality tests used to be the K-S. However, this is no longer the case anymore. The reality is that it is now considered to have very little power. So, when you are trying to use normality tests, you should definitely consider using the Shapiro-Wilk test which is provided by the SPSS software.