Simply put, a t test is a very useful hypothesis test in statistics. Ultimately, you can use the t test to compare means.
One of the things that you need to understand about t tests is that there are two different types of tests: the one-sample t test and the two-sample t test. While the first one allows you to compare a sample mean to a hypothesized value, the second one allows you to compare the means of two groups. When you have two groups with paired observations (e.g., before and after measurements), use the paired t-test.
Learn everything about statistics.
To better understand t tests, it is important that you understand t values as well as t distributions. And this is exactly what we are going to cover today.
What Are T Values?
T tests are all based on t values. So, you can see t values as an example of what statisticians call test statistics.
The reality is that a test statistic is just a standardized value that is determined from sample data considering a hypothesis test. The process or procedure that determines the test statistic compares your data to what is expected under the null hypothesis.
One of the things that you need to keep in mind is that each type of t test uses a specific process or procedure to get to the t value. Notice that all the calculations to determine t values compare your sample mean to the null hypothesis and then incorporates both the variability in the data and the sample size.
Looking to determine the student t value?
So, when you get a t value of 0, this means that the sample results exactly equal to the null hypothesis. Besides, keep in mind that the increase of the difference between the sample data and the null hypothesis leads to the increase of the absolute value of the t values.
Notice that a t value per si doesn’t tell you anything. You need to have a background, a larger context in which you can place individual t values before you can interpret them. This is where t-distributions come in.
Make sure to use our student t value calculator.
What Are T Distributions?
When you do a t test for a single study, you will get only one t value. On the other hand, if you have multiple random samples of the same size from the same population and do the same t test, you will get many different t values. So, with these t values, you can then plot a distribution of all of them. And this is known as the sampling distribution.
One of the best things about sampling distributions is that you actually don’t need a lot of samples collected. The truth is that all the t distributions properties that are already known allow you to plot these different t values correctly.
Check out our student t value calculator.
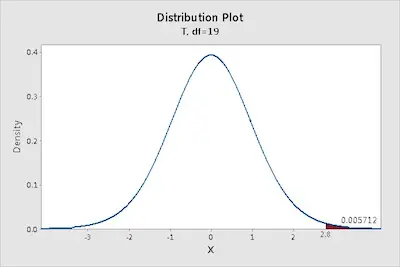
Notice that a specific t distribution is defined by its degrees of freedom which is a value closely related to the sample size.
T-distributions assume that you draw repeated random samples from a population where the null hypothesis is true. You place the t-value from your study in the t-distribution to determine how consistent your results are with the null hypothesis.