Category : t values

Z Score Vs T Score: Understanding The Difference

When you are learning statistics, there are two different but important concepts that you will learn: the z score and t score. However, according to the emails and messages that we get, we have a clear idea that many students find it difficult to understand the differences between z score vs t score. So, today, we decided to tell you a bit more about both the z score and the t score as well as what is the main difference between them. In addition, and in what concerns to the more practical aspect of statistics, we will also show you when you should use the z score and when you need to use the t score. 

z-score-vs-t-score

Use all the best stats calculators in just one place.

So, if you have some difficulties to understand the z score vs t score differences or even some difficulties in understanding these main concepts, make sure to keep reading. 

Z Score Vs T Score

Simply put, both the z score and the t score are both used in hypothesis testing. And this is probably the reason why so many statistics students struggle to know which one to use. 

Generally speaking, in elementary stats, you tend to use more the z score in testing than the t score. Nevertheless, it is important to understand both. 

Discover everything you need to know about the z score table.

What Is A Z Score?
What-Is-A-Z-Score

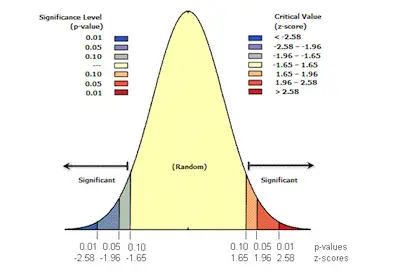
The z score, which is also known as the standard score, gives you an idea about how far from the mean a data point is. In case you want to be more technical, then you can say that the z score is a measure of how many standard deviations below or above the population mean a raw score is. 

One of the most important aspects to keep in mind about the z score is that it can be placed on a normal distribution curve. As you probably already know, z scores range between -3 standard deviations that would be when they fall to the far left of the normal distribution curve and up to +3 standard deviations, which is when they fall to the far right of the normal distribution curve. 

When you need to use a z score, you need to know the mean μ as well as the population standard deviation σ.

Learn how to use the standard normal distribution table.

Notice that z scores are a popular way to compare results to a normal population. As you know, results from tests or surveys have thousands of possible results and these may often seem meaningless. While you may know that you weigh 100 pounds, this is simply meaningless unless you compare it with the average population’s mean weight. 

What Is A T Score?
What-Is-A-T-Score

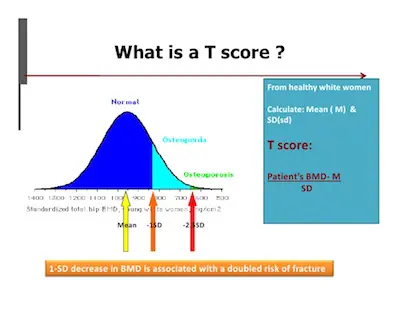
The t score or t statistic is used in a t test when you are trying to either support or reject the null hypothesis. If you think about it, you can actually see some similarities with the z score. After all, you need to find a cut off point, find your t score, and then compare the two. You use the t statistic when you have a small sample size, or if you don’t know the population standard deviation.

One of the main ideas to keep in mind about the t score is that it doesn’t tell you much on its own; it needs to be put in some context. So, with this in mind, you need to actually get more information by taking a sample and running a hypothesis test. 

Check out everything you need to understand and use the standard normal table.

Z Score Vs T Score: Understanding The Difference
Z-Score-Vs-T-Score-Understanding-The-Difference

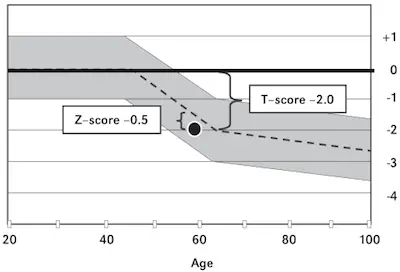
So, now that we showed you a simplified version of what the z score and the t score are, you are probably wondering about when you should use one or the other. 

As a rule of thumb, you should use the t score whenever you have a sample size below 30, and when you have an unknown population standard deviation. On the other hand, whenever you have a sample size that is 30 or more and you know the standard deviation of the population, then you need to use the z score. 


How To Use The Student’s T Test

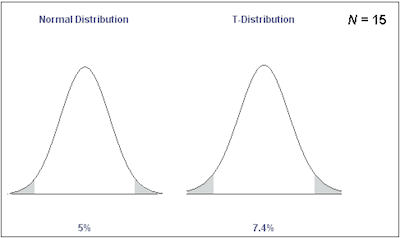
As you probably already know, the t distribution which is also known as the Student’s t, is a probability distribution that looks like a bell-shaped curve. This is also known as the normal distribution curve.

Learn more about statistics.

So, ultimately, if you keep sampling from a population in which the null hypothesis is true, then you know that the t distribution shows the long-run probabilities of various t values occurring.

So, what it the t value?

When you want to calculate a t statistic from your data set, you need to use a formula to test a sample mean:

student’s t test

Determine your student t-value here.

In case you discover that the null hypothesis is true, then this means that the sample mean would likely be close to the value you have under your hypothesis. 

Let’s take a look at an example so it can be easier to understand. Imagine that you have a sample mean that is equal to 52, which is close to the hypothesized mean of 50. This means that you would get a numerator will a value near zero. So, you can then conclude that the t statistic will also be close to zero.

t statistic example 1

Whereas, if your sample mean is further away from the hypothesized mean, let’s say 63, the resulting t statistic would be larger.

t statistic example 2

Now, it is the time to see when the t statistic that you just calculated lies on the t distribution. 

Since we are talking about a normal distribution, a bell-shaped curve, the data clusters about the mean. And while the values further away from the mean (i.e. toward the tails of the distribution) are not impossible if the null hypothesis is true, they are unlikely.

So, with the t distribution tables that are available online, you can get the critical values for the t distribution at different levels of significance. 

Check out our free student t-value calculator.

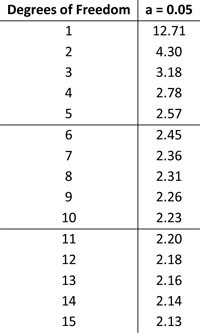
Here’s a screenshot of the table when alpha = 0.05:

table with alpha equal to 5

Notice that the underlying distribution is similar in the different tables. They only vary in what percentage of the distribution is being shown. 

The table we just displayed above tells you that for a specific degree of freedom, what value does 5% of the distribution lie beyond. 

For example, when df (degrees of freedom) = 5, the critical value is 2.57. This means that 5% of the data lies beyond 2.57. So, if your calculated t statistic is equal to or greater than 2.57, you can reject our null hypothesis.

Calculate your student t-value here.

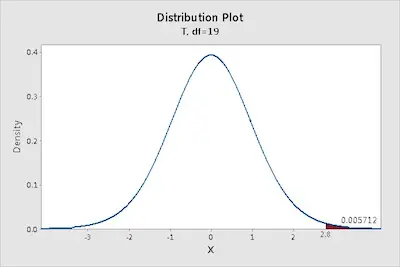
At this point, you need to also take a look at the p-values. In case you don’t know, p-values tell you the probability of obtaining your t statistic, or one more extreme, given the null hypothesis is true. That is, what area of the t distribution lies beyond our calculated t statistic?

t distribution

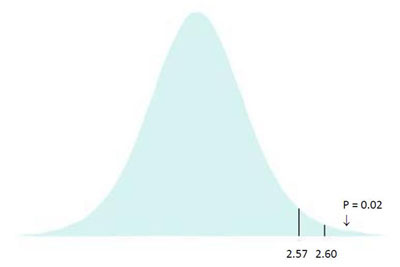
We already pointed out earlier that for 5 degrees of freedom, the critical t value is 2.57. So, this means that 5% of the distribution lies to the right of the line marking 2.57. 

As you can see above, if your sample mean was 63, you get a calculated t statistic of 2.60. 

The area to the right of this line gives you the p-value; the probability of getting this or more extreme, i.e. what area of the distribution lies to the right of 2.60. In this case, the answer is 2% of the distribution, giving you a p-value of 0.02.


Understanding T Values And T Distributions

Simply put, a t test is a very useful hypothesis test in statistics. Ultimately, you can use the t test to compare means. 

t values

One of the things that you need to understand about t tests is that there are two different types of tests: the one-sample t test and the two-sample t test. While the first one allows you to compare a sample mean to a hypothesized value, the second one allows you to compare the means of two groups. When you have two groups with paired observations (e.g., before and after measurements), use the paired t-test.

Learn everything about statistics.

To better understand t tests, it is important that you understand t values as well as t distributions. And this is exactly what we are going to cover today. 

What Are T Values?

What Are T Values

T tests are all based on t values. So, you can see t values as an example of what statisticians call test statistics.

The reality is that a test statistic is just a standardized value that is determined from sample data considering a hypothesis test. The process or procedure that determines the test statistic compares your data to what is expected under the null hypothesis. 

One of the things that you need to keep in mind is that each type of t test uses a specific process or procedure to get to the t value. Notice that all the calculations to determine t values compare your sample mean to the null hypothesis and then incorporates both the variability in the data and the sample size. 

Looking to determine the student t value?

So, when you get a t value of 0, this means that the sample results exactly equal to the null hypothesis. Besides, keep in mind that the increase of the difference between the sample data and the null hypothesis leads to the increase of the absolute value of the t values. 

Notice that a t value per si doesn’t tell you anything. You need to have a background, a larger context in which you can place individual t values before you can interpret them. This is where t-distributions come in.

Make sure to use our student t value calculator.

What Are T Distributions?

t distributions

When you do a t test for a single study, you will get only one t value. On the other hand, if you have multiple random samples of the same size from the same population and do the same t test, you will get many different t values. So, with these t values, you can then plot a distribution of all of them. And this is known as the sampling distribution. 

One of the best things about sampling distributions is that you actually don’t need a lot of samples collected. The truth is that all the t distributions properties that are already known allow you to plot these different t values correctly. 

Check out our student t value calculator.

Notice that a specific t distribution is defined by its degrees of freedom which is a value closely related to the sample size. 

T-distributions assume that you draw repeated random samples from a population where the null hypothesis is true. You place the t-value from your study in the t-distribution to determine how consistent your results are with the null hypothesis.