Category : Z Score

Z Score Vs T Score: Understanding The Difference

When you are learning statistics, there are two different but important concepts that you will learn: the z score and t score. However, according to the emails and messages that we get, we have a clear idea that many students find it difficult to understand the differences between z score vs t score. So, today, we decided to tell you a bit more about both the z score and the t score as well as what is the main difference between them. In addition, and in what concerns to the more practical aspect of statistics, we will also show you when you should use the z score and when you need to use the t score. 

z-score-vs-t-score

Use all the best stats calculators in just one place.

So, if you have some difficulties to understand the z score vs t score differences or even some difficulties in understanding these main concepts, make sure to keep reading. 

Z Score Vs T Score

Simply put, both the z score and the t score are both used in hypothesis testing. And this is probably the reason why so many statistics students struggle to know which one to use. 

Generally speaking, in elementary stats, you tend to use more the z score in testing than the t score. Nevertheless, it is important to understand both. 

Discover everything you need to know about the z score table.
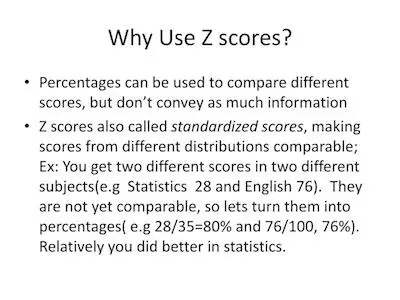
What Is A Z Score?

What-Is-A-Z-Score

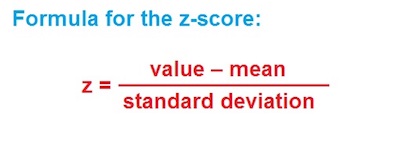
The z score, which is also known as the standard score, gives you an idea about how far from the mean a data point is. In case you want to be more technical, then you can say that the z score is a measure of how many standard deviations below or above the population mean a raw score is. 

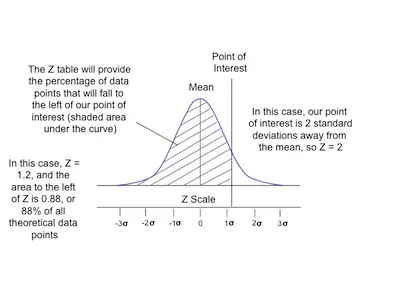
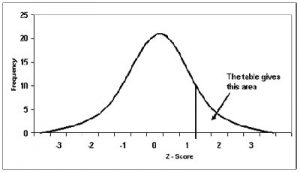
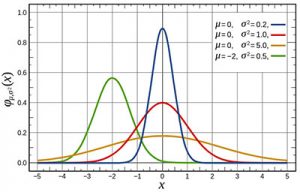
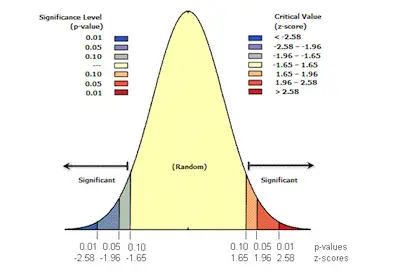
One of the most important aspects to keep in mind about the z score is that it can be placed on a normal distribution curve. As you probably already know, z scores range between -3 standard deviations that would be when they fall to the far left of the normal distribution curve and up to +3 standard deviations, which is when they fall to the far right of the normal distribution curve. 

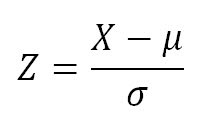
When you need to use a z score, you need to know the mean μ as well as the population standard deviation σ.

Learn how to use the standard normal distribution table.

Notice that z scores are a popular way to compare results to a normal population. As you know, results from tests or surveys have thousands of possible results and these may often seem meaningless. While you may know that you weigh 100 pounds, this is simply meaningless unless you compare it with the average population’s mean weight. 

What Is A T Score?

What-Is-A-T-Score

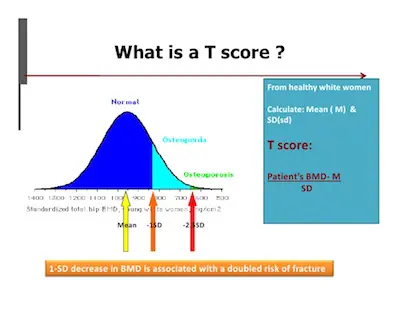
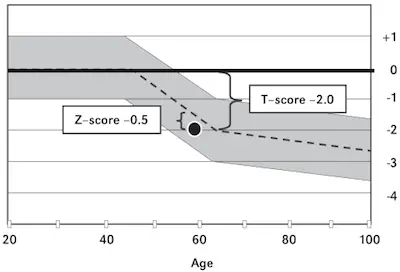
The t score or t statistic is used in a t test when you are trying to either support or reject the null hypothesis. If you think about it, you can actually see some similarities with the z score. After all, you need to find a cut off point, find your t score, and then compare the two. You use the t statistic when you have a small sample size, or if you don’t know the population standard deviation.

One of the main ideas to keep in mind about the t score is that it doesn’t tell you much on its own; it needs to be put in some context. So, with this in mind, you need to actually get more information by taking a sample and running a hypothesis test. 

Check out everything you need to understand and use the standard normal table.

Z Score Vs T Score: Understanding The Difference

Z-Score-Vs-T-Score-Understanding-The-Difference

So, now that we showed you a simplified version of what the z score and the t score are, you are probably wondering about when you should use one or the other. 

As a rule of thumb, you should use the t score whenever you have a sample size below 30, and when you have an unknown population standard deviation. On the other hand, whenever you have a sample size that is 30 or more and you know the standard deviation of the population, then you need to use the z score. 


Examples Of Z Score Calculations

When you are studying statistics, z score calculations are an important part. The truth is that the z score calculations are useful for many different things and you need to ensure that you understand the concepts well. 

Discover the best statistics calculators.

One of the most basic things that you will learn in statistics is how to find the z score for some value of a normally distributed variable. So, today, we decided to show you some examples of z score calculations so you can better understand the concept. But before we begin with the examples, it is always useful to give you a brief insight into z scores. 

Why We Use The Z Score

z-score-calculations

One of the most pertaining questions that many statistics students have is why do we need to learn and understand z scores. 

Notice that while there is only one standard normal distribution, there is an infinite number of normal distributions. Therefore, the main goal of calculating the z score is to relate a specific normal distribution to the standard normal distribution. 

As you probably already know, the standard normal distribution has been being studied for a very long time and there are tables that provide areas underneath the curve – the z score tables. These are the ones that you need to use when you are doing your z score calculations.

Check out the standard normal table.

Since there is an universal use of the standard normal distribution, it is incredibly important to standardize a normal variable. So, you can see the z score as the number of standard deviations that are away from the mean of your distribution. 

The Z Score Formula

The formula that we use to calculate the z score is: 

z = (x – μ)/ σ

Where:

  • x is the value of our variable
  • μ is the value of our population mean.
  • σ is the value of the population standard deviation.
  • z is the z-score.


Take a look at a z score table.

Examples Of Z Score Calculations

looking-at-the-z-tables

Now that we already took a look at the z score concept, it is time to do some z score calculations. This is the best thing you can do to ensure that you understand the concept of the z score. 

Let’s say that you know about a population of a particular breed of cats having weights that are normally distributed. Furthermore, suppose that you also know that the mean of the distribution is 10 pounds and the standard deviation is 2 pounds. 

In the first example, you want to know the z score for 13 pounds. How can you know this?

Simply put, you will simply need to replace the x = 13 into your z-score formula. With that said:

z = (13 – 10)/2 = 1.5

This means that 13 is one and a half standard deviations above the mean.

Check out the standard normal distribution table.

What about if you want to know the z score of 6 pounds? 

As you can easily understand, the process is pretty similar to the previous one. All you need to do now is to replace the variable by 6 instead of 13. 

The result is:

z = (6 – 10)/2 = -2

We can then state that 6 is two standard deviations below the mean.

standard-normal-distribution

What about if you now want to know how many pounds corresponds to a z score of 1.25?

While this may seem a bit trickier question, the reality is that you now know the z score. So, in this case, you will need to solve the formula for x:

1.25 = (x – 10)/2

Multiply both sides by 2:

2.5 = (x – 10)

Add 10 to both sides:

12.5 = x

So, you can see that 12.5 pounds correspond to a z-score of 1.25.


Advantages And Pitfalls Of Using The Z Score

There’s no question that using the z score can be very helpful in certain situations. However, its use may also lead to pitfalls that you need to know about. However, before we start, we believe that it is important to remind you about what actually ar z scores.

using the z score

Discover the best statistics calculators.

What Are Z Scores?

Simply put, z scores are a way that you have that allows you to standardize a score in respect to other scores in the group. As you already know, in order to determine the z score, you need to know both the mean and the standard deviation of the group. 

What Are Z Scores?

So, we can then state that a z score expresses a specific score in terms of how many standard deviations it is away from the mean. 

Looking to know more about the z score table?

Notice that when you convert a raw score into a z score, you are ultimately expressing that score on a z score scale which always has a mean of zero and a standard deviation of one. So, to sum up, when you calculate the z score you are redefining each raw score in terms of how far away it is from the group mean. 

Now that you are already reminded about what a score is, it’s time to check out the advantages and pitfalls of using the z score. 

Advantages Of Using The Z Score

Advantages Of Using The Z Score

As you know, you can’t always use the z score. However, when it is possible, using it can bring different advantages:

#1: Clarity: 

One of the main advantages of using the z score is the fact that you can see and understand the relationship between the raw score and the distribution of scores much clearer. So, this means that it is possible to get an idea of how good or bad a score is relative to the entire group. 

Discover more about the z table.

#2: Comparison: 

Another great advantage of using the z score is related to the fact that you can easily compare scores that are measured on different scales. 

#3: The Area Under The Curve: 

If you think about it, you already know many different properties of the normal distribution. So, by converting to a normal distribution of z scores, you will be able to discover how many scores actually fall between certain limits. So, this means that you can then calculate the probability of a specific score occur. 

#4: The Area Between The Mean And Z:

Ultimately, this specific area of the table tells you the proportion of scores that are between the mean and a specific z score. Notice that this proportion is the area under the curve between those points. 

#5: Area Beyond Z:

This part of the table tells you the proportion of scores that are greater than a specific z score. 

Pitfalls Of Using The Z Score

Pitfalls Of Using The Z Score

#1: When you calculate the z score from raw scores, you may end up losing the meaningfulness of these raw scores. 

Understanding the z score table normal distribution. 

#2: Since you need to know the standard deviations to calculate the z score, you may also lose the meaning standard scores.

#3: When you are using the z score, you may end up magnifying small differences.

#4: Linear transformations require interval data and some of the data that you use may bot be interval level.


How To Find Z Score For A Normally Distributed Data

The z score, that is also known as the standard score, is a very useful statistic. After all, it allows you to determine the probability of a score that is occurring within your normal distribution, as well as it also allows you to compare two scores that have different normal distributions.

When you want to know how to find z score, you will discover that it will convert, or standardize, scores in a normal distribution to z scores. So, it will become a standard normal distribution.

How To Find Z Score?

While we could go on with a theoretical explanation, we believe that it will be a lot easier for you to understand how to find z score if we use an example.

Make sure that you check out our stat tables

Let’s say that your Math teacher decided to do a test and that your class has 50 students. According to his findings, your teacher saw that the mean score was 60 out of 100 and that the variation in scores, or the standard variation, was 15 marks.

So, at this point, you took a look at your test result and you asked your teacher if you had done well by scoring 70 out of 100.

At first sight, it seems that you have done well. After all, considering that the mean score was 60 and you were able to score 70, apparently you did well. However, this conclusion doesn’t include the variations in the scores of all the students in your class. Putting it into statistical terms, it doesn’t consider the standard deviation.

So, how can you know if you did well?

The Standard Normal Distribution And The Standard Score (Z Score)

Whenever you are taking into consideration a normally distributed data, in order to discover the z score you will need to standardize the results.

One of the things that you need to understand is that the standard normal distribution only converts the group of data in your frequency distribution. In order to do it, it considers that the mean is zero and that the standard deviation is 1, just as it is shown in the following chart:

how-to-find-z-score

Since a z score is expressed in terms of the standard deviation from its means, we can use the following formula to determine it:

z-formula

where:

– X = score

– µ = mean

– σ = standard deviation

In case you want to confirm your results, just use our Z Score Calculator.

So, returning to our example, how can you know if you did well or not?

The truth is that in order to discover it, you can rephrase the question: What number (or percentage) of students scored higher than you and what number (or percentage) of students scored lower than you?

If you remember our example, you were able to score 70 out of 100, and the mean score was 60. In addition, we also know that the standard deviation was 15.

So, if you use the z score formula and replace the values for the variables, you will get:

Standard Score,z = ( X – µ ) / σ = (70 – 60) /15 = 10 / 15 = 0.6667

So, you now know that your z score is 0.67. However, since you need to work with either the number or the percentage of students, you need to use a z score table.

normal-distributions

As you can see in the table shown, you’ll need to find 0.6 in the y-axis, and the 0.07 in the x-axis. In this case, you will see a value of 0.2514.

But what does this number mean? Simply put, it means that the probability of a score is greater than 0.67 is 0.2514. If we multiply it by 100 to get the percentage, we can say that about 25% of the students in your class got a better mark than you.

So, while it seemed that you had done well on the test, we can say that you did better than most other students in your class, you weren’t one of the best.