One of the most simple concepts that you will learn in your statistics classes is the z table. And the truth is that it can be quite helpful.
Discover everything you need to know about statistics.
What Is A Z Table?
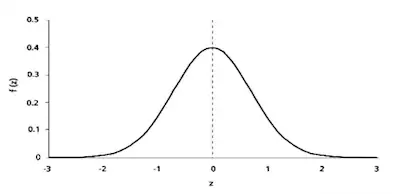
Simply put, a z table is a mathematical table that allows you to determine the percentage of the values below a z score (to the left) in a normal standard distribution. One of the things that you may not know is that a z table is also known as the standard normal table.
Learn more about the z table here.
In order to better understand and to even use a z table, you need to first know and calculate the z score.
What is The Z Score?
Simply put, the z score which is also known as the standard score, tells you the number of standard deviations a raw score lays above or below the mean.
It is worth to keep in mind that when you calculate the man of the z score, you will see that it is always zero. In addition, the variance or the standard deviation is always in increments of 1.
Learn more about the calculation of the z score value.
How To Use A Z Table?
One of the things that you need to know about the z table is that it is actually divided into two different parts – the area to the left of a positive z score and the are to the right of a positive z score. So, let’s take a look at each one of these situations.
#1: Finding The Area To The Left Of A Positive Z Score:
If you take a closer look at the z score table, you will see that it usually uses the decimal figure. So, as you get this decimal value, you just need to multiple it by 100 to get its percentage.
Let’s say that you just calculated the z score and that you got a value of 1.09. So, in this case, you will need to first take a look at the left side column of the z table to discover the value that corresponds to one decimal place of the z score. In this case, this is 1.0.
Then, you will need to look up for the rest of the number. But this time, you’ll need to find the 0.09 on the top of the table.
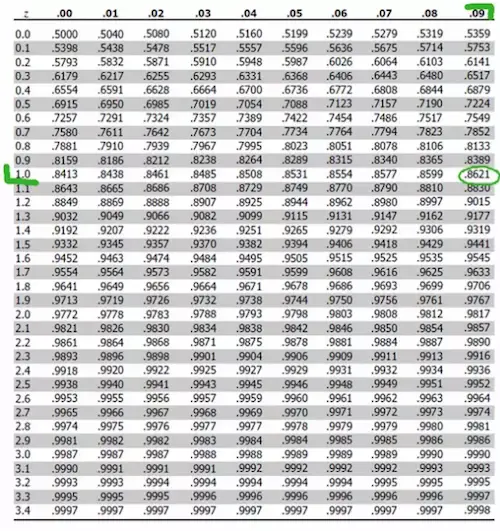
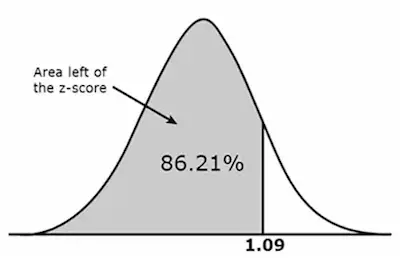
As you can see, the cell where both numbers intersect is equal to 0.8621. So, as we already mentioned above, you just need to multiply this decimal by 100 to get its percentage:
0.8621 X 100 = 86.21%
We can then say that the corresponding area is 86.21% below (or to the left) of the z score.
Discover more about the standard normal table.
#2: Finding The Area To The Right Of A Positive Z Score:
When you need to find the area to the right of a positive z score, the procedure is mainly the same.
Ultimately, you just need to keep in mind that since the total area under the bell curve is 1 which is equivalent to 100%, then you will need to subtract the area from the table from 1.
Let’s assume that you are using the same z score that you discovered above (1.09). As you already checked the table, you know that it corresponds to the decimal 0.8621. So, the area to the right of z = 1.09 is:
1 – 0.8621 = 0.1379
#3: Finding The Area To The Left Of A Negative Z Score:
Let’s say that you just calculated your z score and that you got a negative value. While this may seem confusing, you just need to ignore the negative sign and then subtract the area from the table from 1.
#4: Finding The Area To The Right Of A Negative Z Score:
Again, you will simply need to disregard the minus signal and proceed the same way.