Covariance In Statistics
We can definitely state that covariance is one of the most common and basic measurements when you are talking about statistics. But what is covariance?

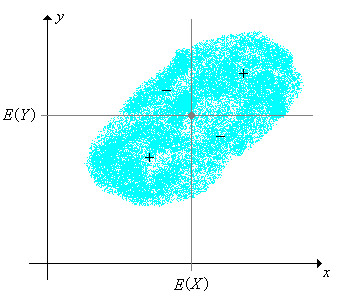
Simply put, covariance is the measurement of how much two random variables can vary together. While you may think that covariance is very similar to variance, the truth is that while variance tells you how just one single variable varies, covariance tells you how two different variables vary together.
Make sure to use the top statistical calculators online.
The Covariance Formula
In order to determine the covariance between two different variables, you can use the following formula:
Cov(X,Y) = Σ E((X-μ)E(Y-ν)) / n-1
Where,
X = a random variable
E(X) = μ = the expected value, or the mean, of the random variable X
E(Y) = ν = the expected value, or the mean, of the random variable Y
n = number of items in the data set
Covariance Example
The truth is that while you may have completely understood what covariance is, there is nothing better than a simple example to see how everything works out.
Let’s say that you want to determine the covariance for the following data set:
x: 2.1, 2.5, 3.6, 4.0 (mean = 3.1)
y: 8, 10, 12, 14 (mean = 11)
Discover the two sample t test explained.
Now, you just need to replace the values in the formula that we just showed you above:
Cov(X,Y) = ΣE((X-μ)(Y-ν)) / n-1
Cov(X,Y) = (2.1-3.1)(8-11)+(2.5-3.1)(10-11)+(3.6-3.1)(12-11)+(4.0-3.1)(14-11) /(4-1)
Cov(X,Y) = (-1)(-3) + (-0.6)(-1)+(.5)(1)+(0.9)(3) / 3
Cov(X,Y) = 3 + 0.6 + .5 + 2.7 / 3
Cov(X,Y) = 6.8/3
Cov(X,Y) = 2.267
Since the covariance result is positive, we can then say that the variables x and y are positively related.
Covariance – The Problems With Interpretation Of The Results

One of the things that you need to know about covariance is that there may be some problems with the interpretation of the results.
When you have a large covariance, this can suggest a strong relationship between the two variables you are considering. Nevertheless, you just can’t compare the variances of data sets that have different scales. This means that if you want to compare a data set expressed in inches with a data set expressed in inches, you can’t do it.
One of the main problems that you have, when you are trying to interpret the results of covariance, is when you have a wide range of results.
Take a look at some Z test example problems.
Let’s say that your data set can give you a value anywhere between 1 and 1,000. This may lead to a simple problem: the larger the values of the X and the Y, the larger the covariance will be. Let’s assume that you get a covariance result of 100. This value tells you that the two variables are correlated but you can’t notice how strong this relationship is.
When you are in such a case, the best thing you can do is to divide the covariance by the standard deviation. This way, you will get the correlation coefficient.
Learn more about quantitative reasoning.
But why should you use the correlation coefficient?
The reality is that on some occasions, it is better to use the Correlation Coefficient rather than the covariance. After all:
– Correlation tends to be more useful to determine how strong the relationship between two different variables is because covariance has numerical limitations.
– Covariance results can be any number while correlation results need to be between -1 and +1.
– Correlation isn’t usually affected by the scale of the variables or by the mean (or the center).
– While correlation doesn’t’ have units, covariance has units.