Degrees Of Freedom For T Tests
In case you just started learning statistics or if you already had some classes about it, you probably already heard about degrees of freedom.
Simply put, in statistics, the degrees of freedom indicate the number of independent values that can vary in an analysis without breaking any constraints.

While this may seem a simple concept (and it is), you need to know that you will need to work with it in many different statistics fields. These include probability distributions, hypothesis tests, and even regression analysis.
Understanding The Degrees Of Freedom
Before we show you more about the degrees of freedom for t tests, we believe that it is a good idea to tell you more about degrees of freedom in the first place.
As we already mentioned above, the degrees of freedom are simply the number of independent values that a statistical analysis can estimate. In case this seems very technical, you just need to keep in mind that they are the number of values that can vary freely as you estimate parameters.
Check out our student t-value calculator.
Notice that understanding the degrees of freedom is very simple. So, in case you prefer, you can look at them and keep in mind that they encompass the idea that the amount of independent information that you have may limit the number of parameters that you can estimate.
In most cases, the degrees of freedom are equal to the difference between your sample size and the number of parameters that you need to calculate during an analysis. Besides, it is important to keep in mind that this is usually a positive whole number.
As you can easily understand, the degrees of freedom are a mix or a combination of how much data you have and how many parameters you need to estimate. So, ultimately, the degrees of freedom show you how much independent information goes into a parameter estimate.
When you understand this concept, it is easy to understand that it’s easy to see that you want a lot of information to go into parameter estimates to obtain more precise estimates and more powerful hypothesis tests. So, you want many degrees of freedom.
Calculate the student t-value using our free calculator.
Degrees Of Freedom For T Tests
As you probably already know, t tests are hypothesis tests for the mean and they use the t distribution to determine statistical significance.
When you are using the simple t test or the 1-sample t test as it is also known, you are looking to determine if the difference between the sample mean and the null hypothesis value is statistically significant.
As you already know, when you have a sample and estimate the mean, you have n – 1 degrees of freedom, where n is the sample size. So, for a 1-sample t test, the degrees of freedom is n – 1.
Need help to determine the student t-value?
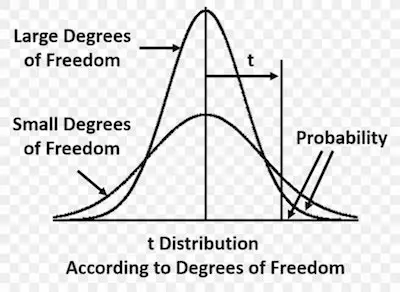
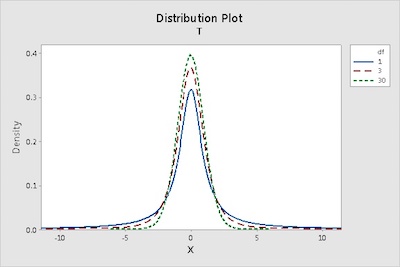
Notice that the degrees of freedom define the shape of the t distribution that your t-test uses to calculate the p-value.
One of the things that is important to notice is that as the degrees of freedom decreases, the t-distribution has thicker tails. This property allows for the greater uncertainty associated with small sample sizes.