Examples Of Z Score Calculations
When you are studying statistics, z score calculations are an important part. The truth is that the z score calculations are useful for many different things and you need to ensure that you understand the concepts well.
Discover the best statistics calculators.
One of the most basic things that you will learn in statistics is how to find the z score for some value of a normally distributed variable. So, today, we decided to show you some examples of z score calculations so you can better understand the concept. But before we begin with the examples, it is always useful to give you a brief insight into z scores.
Why We Use The Z Score

One of the most pertaining questions that many statistics students have is why do we need to learn and understand z scores.
Notice that while there is only one standard normal distribution, there is an infinite number of normal distributions. Therefore, the main goal of calculating the z score is to relate a specific normal distribution to the standard normal distribution.
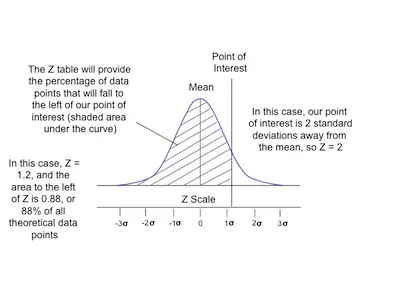
As you probably already know, the standard normal distribution has been being studied for a very long time and there are tables that provide areas underneath the curve – the z score tables. These are the ones that you need to use when you are doing your z score calculations.
Check out the standard normal table.
Since there is an universal use of the standard normal distribution, it is incredibly important to standardize a normal variable. So, you can see the z score as the number of standard deviations that are away from the mean of your distribution.
The Z Score Formula
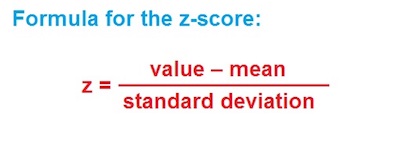
The formula that we use to calculate the z score is:
z = (x – μ)/ σ
Where:
- x is the value of our variable
- μ is the value of our population mean.
- σ is the value of the population standard deviation.
- z is the z-score.
Take a look at a z score table.
Examples Of Z Score Calculations

Now that we already took a look at the z score concept, it is time to do some z score calculations. This is the best thing you can do to ensure that you understand the concept of the z score.
Let’s say that you know about a population of a particular breed of cats having weights that are normally distributed. Furthermore, suppose that you also know that the mean of the distribution is 10 pounds and the standard deviation is 2 pounds.
In the first example, you want to know the z score for 13 pounds. How can you know this?
Simply put, you will simply need to replace the x = 13 into your z-score formula. With that said:
z = (13 – 10)/2 = 1.5
This means that 13 is one and a half standard deviations above the mean.
Check out the standard normal distribution table.
What about if you want to know the z score of 6 pounds?
As you can easily understand, the process is pretty similar to the previous one. All you need to do now is to replace the variable by 6 instead of 13.
The result is:
z = (6 – 10)/2 = -2
We can then state that 6 is two standard deviations below the mean.

What about if you now want to know how many pounds corresponds to a z score of 1.25?
While this may seem a bit trickier question, the reality is that you now know the z score. So, in this case, you will need to solve the formula for x:
1.25 = (x – 10)/2
Multiply both sides by 2:
2.5 = (x – 10)
Add 10 to both sides:
12.5 = x
So, you can see that 12.5 pounds correspond to a z-score of 1.25.