How To Find Z Score For A Normally Distributed Data
The z score, that is also known as the standard score, is a very useful statistic. After all, it allows you to determine the probability of a score that is occurring within your normal distribution, as well as it also allows you to compare two scores that have different normal distributions.
When you want to know how to find z score, you will discover that it will convert, or standardize, scores in a normal distribution to z scores. So, it will become a standard normal distribution.
How To Find Z Score?
While we could go on with a theoretical explanation, we believe that it will be a lot easier for you to understand how to find z score if we use an example.
Make sure that you check out our stat tables.
Let’s say that your Math teacher decided to do a test and that your class has 50 students. According to his findings, your teacher saw that the mean score was 60 out of 100 and that the variation in scores, or the standard variation, was 15 marks.
So, at this point, you took a look at your test result and you asked your teacher if you had done well by scoring 70 out of 100.
At first sight, it seems that you have done well. After all, considering that the mean score was 60 and you were able to score 70, apparently you did well. However, this conclusion doesn’t include the variations in the scores of all the students in your class. Putting it into statistical terms, it doesn’t consider the standard deviation.
So, how can you know if you did well?
The Standard Normal Distribution And The Standard Score (Z Score)
Whenever you are taking into consideration a normally distributed data, in order to discover the z score you will need to standardize the results.
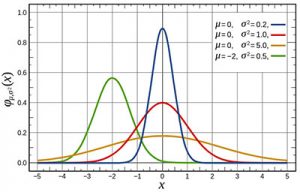
One of the things that you need to understand is that the standard normal distribution only converts the group of data in your frequency distribution. In order to do it, it considers that the mean is zero and that the standard deviation is 1, just as it is shown in the following chart:
Since a z score is expressed in terms of the standard deviation from its means, we can use the following formula to determine it:
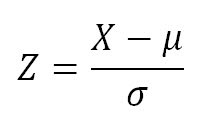
where:
– X = score
– µ = mean
– σ = standard deviation
In case you want to confirm your results, just use our Z Score Calculator.
So, returning to our example, how can you know if you did well or not?
The truth is that in order to discover it, you can rephrase the question: What number (or percentage) of students scored higher than you and what number (or percentage) of students scored lower than you?
If you remember our example, you were able to score 70 out of 100, and the mean score was 60. In addition, we also know that the standard deviation was 15.
So, if you use the z score formula and replace the values for the variables, you will get:
Standard Score,z = ( X – µ ) / σ = (70 – 60) /15 = 10 / 15 = 0.6667
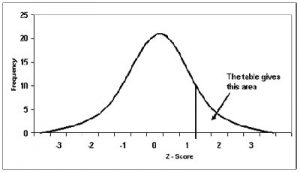
So, you now know that your z score is 0.67. However, since you need to work with either the number or the percentage of students, you need to use a z score table.
As you can see in the table shown, you’ll need to find 0.6 in the y-axis, and the 0.07 in the x-axis. In this case, you will see a value of 0.2514.
But what does this number mean? Simply put, it means that the probability of a score is greater than 0.67 is 0.2514. If we multiply it by 100 to get the percentage, we can say that about 25% of the students in your class got a better mark than you.
So, while it seemed that you had done well on the test, we can say that you did better than most other students in your class, you weren’t one of the best.