How To Use The Student’s T Test
As you probably already know, the t distribution which is also known as the Student’s t, is a probability distribution that looks like a bell-shaped curve. This is also known as the normal distribution curve.
So, ultimately, if you keep sampling from a population in which the null hypothesis is true, then you know that the t distribution shows the long-run probabilities of various t values occurring.
So, what it the t value?
When you want to calculate a t statistic from your data set, you need to use a formula to test a sample mean:

Determine your student t-value here.
In case you discover that the null hypothesis is true, then this means that the sample mean would likely be close to the value you have under your hypothesis.
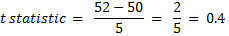
Let’s take a look at an example so it can be easier to understand. Imagine that you have a sample mean that is equal to 52, which is close to the hypothesized mean of 50. This means that you would get a numerator will a value near zero. So, you can then conclude that the t statistic will also be close to zero.
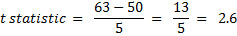
Whereas, if your sample mean is further away from the hypothesized mean, let’s say 63, the resulting t statistic would be larger.
Now, it is the time to see when the t statistic that you just calculated lies on the t distribution.
Since we are talking about a normal distribution, a bell-shaped curve, the data clusters about the mean. And while the values further away from the mean (i.e. toward the tails of the distribution) are not impossible if the null hypothesis is true, they are unlikely.
So, with the t distribution tables that are available online, you can get the critical values for the t distribution at different levels of significance.
Check out our free student t-value calculator.
Here’s a screenshot of the table when alpha = 0.05:
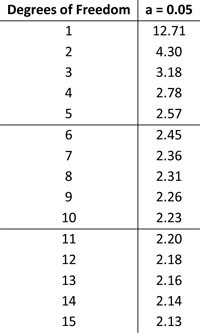
Notice that the underlying distribution is similar in the different tables. They only vary in what percentage of the distribution is being shown.
The table we just displayed above tells you that for a specific degree of freedom, what value does 5% of the distribution lie beyond.
For example, when df (degrees of freedom) = 5, the critical value is 2.57. This means that 5% of the data lies beyond 2.57. So, if your calculated t statistic is equal to or greater than 2.57, you can reject our null hypothesis.
Calculate your student t-value here.
At this point, you need to also take a look at the p-values. In case you don’t know, p-values tell you the probability of obtaining your t statistic, or one more extreme, given the null hypothesis is true. That is, what area of the t distribution lies beyond our calculated t statistic?
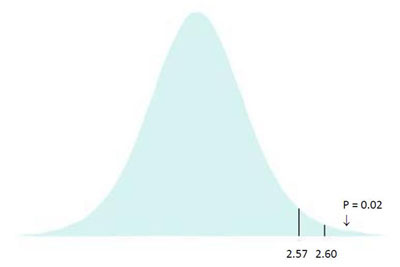
We already pointed out earlier that for 5 degrees of freedom, the critical t value is 2.57. So, this means that 5% of the distribution lies to the right of the line marking 2.57.
As you can see above, if your sample mean was 63, you get a calculated t statistic of 2.60.
The area to the right of this line gives you the p-value; the probability of getting this or more extreme, i.e. what area of the distribution lies to the right of 2.60. In this case, the answer is 2% of the distribution, giving you a p-value of 0.02.