T Distribution Table
T Table
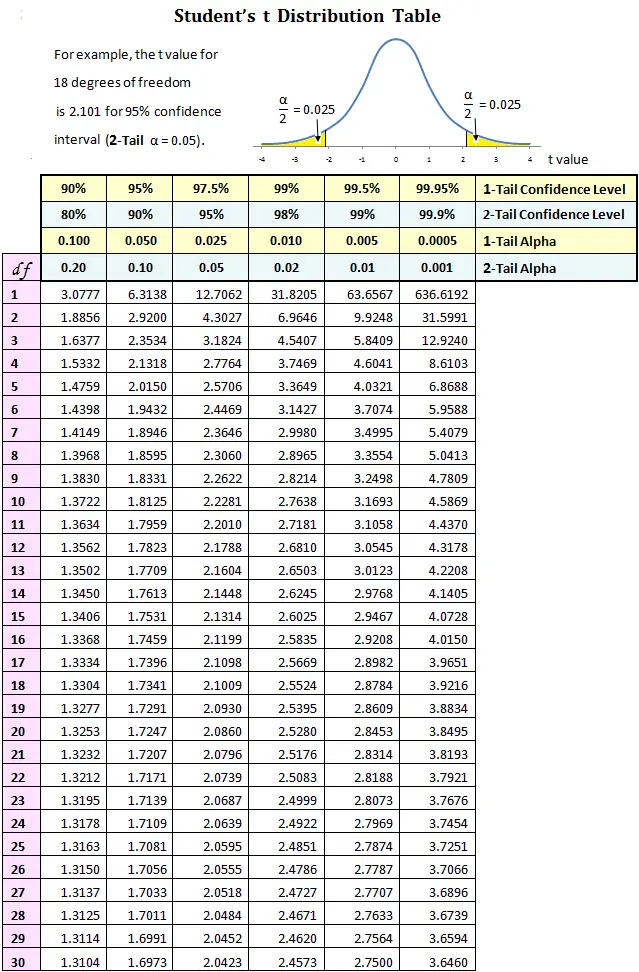
Given below is the T Table, otherwise known as the Student’s T-table or T-distribution table. This T table contains both one-tailed T-distribution and two-tailed T-distribution, degrees of freedom up to 1000, and a confidence level up to 99.9%.
Use this T-Distribution Table to lookup T critical value for confidence level & degrees of freedom for one tail & two-tails.
Related Calculators
<strong>Student t-Value Calculator</strong> <strong>Effect Size (Cohen's d) for a Student t-Test Calculator</strong> <strong>p-Value Calculator for a Student t-Test</strong> <strong>T-Statistic and Degrees of Freedom Calculator</strong>What Is a T-Distribution?
Otherwise known as the Student’s T-distribution, the T-distribution is a type of probability distribution, with its bell shape, that is similar to the normal distribution, though it has heavier tails. T distributions have fatter tails, therefore, a greater chance for extreme values than normal distributions.
What Does a T-Distribution Tell?
A parameter of the T-distribution called degrees of freedom determines tail heaviness. Higher values of the mentioned parameter make the T-distribution resemble a standard normal distribution with a mean of 0, and a standard deviation of 1. Smaller values of this parameter give heavier tails.
When utilizing the estimated standard deviation, a T-score is calculated as:
T = (m – M)/{d/sqrt(n)}, rather than making the normal distribution with mean 0 and standard deviation 1, the contrast between d and D makes the distribution a T-distribution with (n – 1) degrees of freedom.
How To Utilize The T-Table?
Further, we are going to learn how to read the T-Table and map critical values on it using examples, but first, we will require a few things or pre-requisites before we can do that.
The pre-requisites needed to use a T-table are as follows:
The number of tails:
Firstly, you need to know whether the T-test is one-tailed or two-tailed because we will use the respective one-tail or two-tail row to mark the alpha level. The alpha levels are listed at top of the table [0.50, 0.25, 0.20, 0.15…for the one-tail and 1.00, 0.50, 0.40, 0.30, etc. for the two-tails] and as you can see, they differ based on whether the T-test is one-tailed or two-tailed.
Degrees of freedom:
The degrees of freedom [df] show the number of independent values that can differ in an analysis without breaking any constraints. The degrees of freedom will either be explicitly cited in the problem statement or if it is not explicitly cited, then all you have to do is subtract one from your sample size (n – 1), and the result you get will be your degrees of freedom.
Alpha level:
The significance level, otherwise known as the alpha level (α), is the probability of rejecting the null hypothesis when it is true. The common alpha (α) levels for the T-test are 0.01, 0.05 and 0.10
Once you have all three significance levels, you have to pick the respective column for one-tail or two-tail from the table and map the intersection of the values for the degrees of freedom [df] and the alpha (α) level.
Example Questions:
Example #1 – Let’s say we want to map a one-tailed t-test for a mean with an alpha level of 0.05. The total number of students involved in this study is 25. To what critical value t should be compared?
Solution – Firstly, we see that there are 25 students involved in this study. We have to subtract 1 from the sample size to get the degrees of freedom [df]. Therefore, df = n – 1 = 25 – 1 = 24.
Example #2 – For a study involving one population and a sample size of 18 (assuming you have a t-distribution), what row of the t-table will you use to find the right-tail – “greater than” – probability associated with the study results?
A sample size of 18 has n – 1 = 18 – 1 = 17 degrees of freedom when the study involves one population.
Solution – df = 17
Example #3 – For a study involving a paired design with a total of 44 observations, with the results assuming a t-distribution, in order to find the probability affiliated with the study results, what row of the table will you use?
22 pairs are in a matched-pairs design with 44 total observations. The degrees of freedom [df] is one less than the number of pairs: n – 1 = 22 – 1 = 21.
Solution: df = 21
Example #4 – A t-value of 2.35, from a t-distribution with 14 degrees of freedom, between which two values has an upper-tail – “greater than” – probability on the t-table?
Find the row with 14 degrees of freedom and look for 2.35 utilizing the T-table. However, this exact value doesn’t lie in this row, so look for the values on either side of it: 2.1448 and 2.6245. The upper-tail probabilities appear in the column headings; the column heading for 2.1448 is 0.025, and the column heading for 2.6245 is 0.010.
Therefore, the upper-tail probability for a T-value of 2.35 must lie between 0.025 and 0.010.
Solution: 0.025 and 0.010.