The Ultimate Guide To Descriptive Statistics
Simply put, descriptive statistics is a way that you have to summarize and organize the data that you collect. This way, it will be easier to understand it.
A lot of people tend to use descriptive statistics and inferential statistics in the same way. However, the two concepts are different. When you use descriptive statistics, you are looking for a way to describe the data but you aren’t trying to make any kind of inferences from the sample that you are looking at to the whole population.
The best statistical calculators are available here.
The Different Types Of Descriptive Statistics
Overall, we can easily divide descriptive statistics into two different categories:
#1: Measures Of Central Tendency:
Within this descriptive statistics category, you can assume that there is a number that is central to the set or that is the best representation of the entire set of measurements.
Learn more about determining the measures of central tendency.
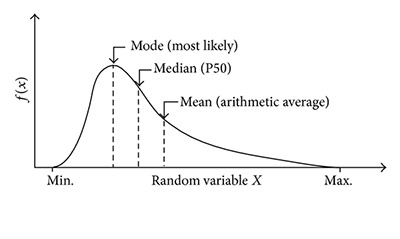
Here are some examples of measures of central tendency:
– Mean: The mean is simply the number around which the entire data is spread out. In this case, only a number – the mean – can be seen as the best representation of the whole data.
– Median: When you divide your set of data in two equal parts, you get one number at the medium which is called the median. Notice that in order to determine the median, the numbers of the set should be organized in an ascending or descending order. In case the number of terms of the set is odd, the median is the middle term; in case the number of terms of the set is even, the median will be equal to the average of the two middle terms.
Check out these statistical questions examples.
– Mode: Simply mode, the mode is the term that appears more time on the data set.
#2: Measures Of Variability (Spread):
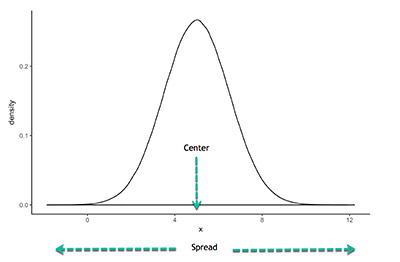
The measures of variability assume that your data includes some variability.
Here are some examples of measures of variability or spread:
– Standard Deviation: The standard deviation shows how the data is spread out from the mean So, in order to calculate the standard deviation, you needs to set the difference between each quantity and the mean. When you have the standard deviation is low, this means that the data points are closer to the mean of the data set. On the other hand, when you get a high standard deviation, the data points are spread out over more values and not concentrated around the mean only.
Understanding what a statistical question is.
– Mean Absolute Deviation Or Mean Deviation: This is the average of the absolute differences between each value and the average of all values of your data set.
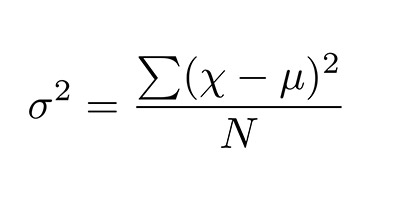
– Variance: The variance is simply the square of the standard deviation. So, we can also say that the variance is the square of the average distance between each quantity and mean.
– Range: The range is the difference between the lowest and the highest value of your data set.
– Percentile: When you want to represent the position of the values that you ave on your data set, you can use the percentile. Notice that when you want to calculate the percentile, you need to have your data set in ascending order.