Understand Unpaired T Test For Two Samples
As you probably already know, a t test is very important in statistics and it tends to be used for a wide variety of subjects and topics. Since it can be used as a very broad test, the truth is that there are some derivations of this test, specifically the unpaired t test.
But what exactly is the unpaired t test?
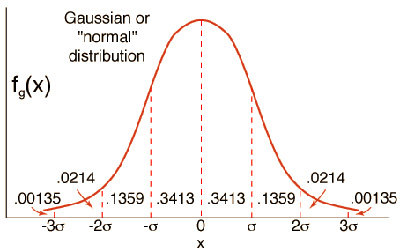
Simply put, the unpaired t test allows you to compare the means of two different samples. However, in order to perform this test, the values need to follow the Gaussian distribution.
Besides, there are some assumptions that you can withdraw when the unpaired t test was performed:
Check out the most important stats calculators that you need.
#1: The Two Populations Have The Same Variances:
When you perform an unpaired t test, you assume that both populations have different variances as well as the same standard deviation. While this may not mean much for you so far, you will learn that when populations have different variances this fact can be as important as discovering that they have different means.
#2: The Data Needs To Be Unpaired:
Whenever you have data that is a match or paired, you should use the paired t test instead.
Discover the basic statistics that you need to know about for data science.
#3: You Can Only Compare Two Groups:
One of the most common mistakes statistics students make when they are learning more about t tests and the unpaired t test is to use the unpaired t test multiple times in a row. However, this is something that you should avoid or you’ll be increasing the risk of finding a statistically significant difference by chance. Ultimately, this will make it harder for you to interpret both the statistical significance level as well as the P-value. When you need to make multiple comparisons, a better approach is to use the one-way ANOVA.
So, how do you do an unpaired t test?
As you already know, an unpaired t test is used when you want to compare two population means. Usually, this is how you will see the notations:
n1, n2 – refer to the sample sizes of population 1 and 2, respectively
x¯1, x¯2 – refer to the sample means of population 1 and 2, respectively
s1, s2 – refer to the standard deviation of population 1 and 2 respectively.
Here is how the procedure of carrying out an unpaired t test works:
1. You will be assuming that the null hypothesis states that the two population means are equal. Or:
H0: x¯1 = x¯2
2. The first thing that you will need to do is to determine the difference between the two sample means, or:
x¯1 – x¯2
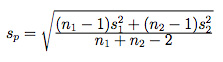
3. Next, you will need to take a closer look at the standard deviation. However, you won’t be looking at the standard deviation of each one of the samples individually. Instead, you will need to calculate the pooled standard deviation:
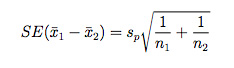
4. In this step, you will need to determine the standard error of the difference between the two means. So, you will need to use the following formula:
5. Now, it is finally time to determine the t-statistic. You can easily do it by using the formula:
t = ( x¯1 – x¯2 ) / SE ( x¯1 – x¯2 )
Please note that when you are testing the null hypothesis, you already know that the t will follow a t-distribution with n1 + n2 – 2 degrees of freedom.
Learn more about statistical questions.
6. Finally, you will need to use the t-distribution tables to compare the value of the t that you got with the tn1+n2−2 distribution. This will give you the p-value for the unpaired t test.
As you ca see, the unpaired t test is easily done. While it includes multiple steps, it is very simple to perform. Nevertheless, if you are seeing all this information for the first time, it may be a bit harder to understand this test without any values. So, let’s take a look at an example of an unpaired t test.
Unpaired T Test – Practical Example:
Let’s say that a company decided to do a study about the number of calories included in the hotdog meat. The truth is that not all hotdog meat is the same and there are some brands that use beef and others that use poultry. So, as you can imagine, the calories contained in both dogs should be different.
After processing the data, the company presented the following data:
| Group | Sample Size | Sample Mean | Sample Standard Deviation |
|---|---|---|---|
| Beef | 20 | 156.85 | 22.64 |
| Poultry | 17 | 122.47 | 25.48 |
Since we believe these values can follow the Gaussian distribution, we can then proceed with the unpaired t test that we just described above.
1. Let’s start by determining the difference of the means: x¯1 – x¯2
In this case, x¯1 – x¯2 = 156.85 − 122.47 = 34.38
2. Now, it is time to determine the pooled standard deviation. By replacing the numbers of the table into the formula directly:
Sp = √ [[ (n1-1)s1^2 + (n2-1)s2^2 ] / n1 + n2 – 2] = √ [[ (19)22.64^2 + (16)25.48^2 ] / 35] = 23.98
3. Now, in order to determine SE(¯x1 − x¯2):
SE(¯x1 − x¯2) = Sp√ [ (1/n1) + (1/n2) ] = 23.98√[ (1/20)+(1/17) ] = 7.91
What exactly is a statistical question?
4. Finally, you can now calculate the value of the T:
t = ( x¯1 – x¯2 ) / SE ( x¯1 – x¯2 )
t = 34.38/7.91
5. By checking the tables of the t-distribution with 35 degrees of freedom, you will easily discover that p<0.001. So, we can say, almost for sure or with a high degree of certainty, that poultry dogs have fewer calories than beef hotdogs.
Even if you are just learning statistics and the unpaired t test for the first time, we believe that you now have a good knowledge about this specific test and that you won’t have any problems with the procedure.