Why Adding Values On A Scale Can Lead To Measurement Error
When some statistics students look at a multi-item scale to measure a construct, they are lead in error and they, sometimes, start adding values on a scale. But this shouldn’t be done at all. Instead, a key step is to actually create a score for each subject in the data set.
Discover the best online statistics calculators you need.
Simply put, this score is an estimate of the value of the latent constructor or factor the scale is measuring for each subject. In case you haven’t seen it yet, we are actually running the final step of a Confirmatory Factor Analysis.

When you are looking for the simplest way to create a score, you will need to either average or add up the values of each variable on the indicator or scale for each subject. This is called a factor-based score. It’s based on the factor in the factor analysis, but is not technically a factor score since it doesn’t use the factor weights. But the problem is that this method is far away from being able to be accepted.
Why Adding Values On A Scale Can Lead To Measurement Error
The best estimate of the subject’s value on the latent construct you’re measuring with your observed indicator variables is the true factor score. After all, the factor loadings, as calculated by the analysis, determines the optimal weighting for each indicator.
Make sure to use out standard error calculator.
Notice that when the EFA/CFA and structural equation models “predict” the factor scores it uses a linear regression, incorporating the factor loadings into the model.
So, here’s an example when you need to compare the difference between the “add up the scores” and linear regression approach. We will use five indicators together model the latent construct of Assertiveness:
AS3 Automatically take charge
AS4 Know how to convince others
AS5 Am the first to act
AS6 Take control of things
AS7 Wait for others to lead the way
The table below gives the coefficients generated by the linear regression approach. For the addition method, the mean of the linear regression coefficients was used to evenly weight the variables.

The two approaches will not generate similar scores. If you check it closely, the AS3’s weighting is 52% greater and AS4 is – 47% less using linear regression compared to addition.
Discover how to calculate standard error.
Notice that if the factor loadings are all equal, it makes sense to use addition. In this particular case, we can add up the scores for each indicator to generate the factor scores. However, we cannot assume they are equal without testing them.
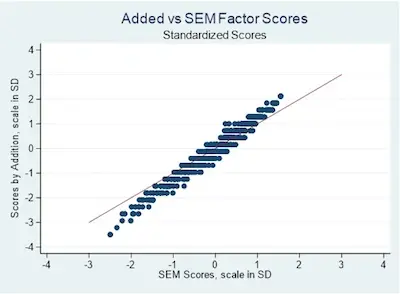
While we believe we have explained this concept well, we also believe that taking a look at it visually may help you understand the concept better. So, in this visual, we will be comparing the factor scores generated by a structural equation model and adding the indicator scores together.
The factor scores generated by the structural equation model are standardized, with a mean of zero and a standard deviation of 1. To compare the addition approach scores we will standardize them as well.
Looking for the standard error calculation online?

As you can see, we have a scatterplot of the SEM and addition generated scores. Notice that the diagonal line represents the line where the scores generated by the two methods are equal.
If you take a closer look at the image above, you can see that there are very few points on the diagonal line and the generated scores aren’t the same.