Z Score Vs T Score: Understanding The Difference
When you are learning statistics, there are two different but important concepts that you will learn: the z score and t score. However, according to the emails and messages that we get, we have a clear idea that many students find it difficult to understand the differences between z score vs t score. So, today, we decided to tell you a bit more about both the z score and the t score as well as what is the main difference between them. In addition, and in what concerns to the more practical aspect of statistics, we will also show you when you should use the z score and when you need to use the t score.

Use all the best stats calculators in just one place.
So, if you have some difficulties to understand the z score vs t score differences or even some difficulties in understanding these main concepts, make sure to keep reading.
Z Score Vs T Score
Simply put, both the z score and the t score are both used in hypothesis testing. And this is probably the reason why so many statistics students struggle to know which one to use.
Generally speaking, in elementary stats, you tend to use more the z score in testing than the t score. Nevertheless, it is important to understand both.
Discover everything you need to know about the z score table.
What Is A Z Score?

The z score, which is also known as the standard score, gives you an idea about how far from the mean a data point is. In case you want to be more technical, then you can say that the z score is a measure of how many standard deviations below or above the population mean a raw score is.
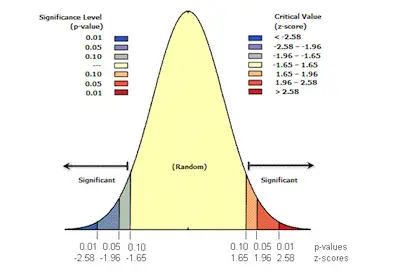
One of the most important aspects to keep in mind about the z score is that it can be placed on a normal distribution curve. As you probably already know, z scores range between -3 standard deviations that would be when they fall to the far left of the normal distribution curve and up to +3 standard deviations, which is when they fall to the far right of the normal distribution curve.
When you need to use a z score, you need to know the mean μ as well as the population standard deviation σ.
Learn how to use the standard normal distribution table.
Notice that z scores are a popular way to compare results to a normal population. As you know, results from tests or surveys have thousands of possible results and these may often seem meaningless. While you may know that you weigh 100 pounds, this is simply meaningless unless you compare it with the average population’s mean weight.
What Is A T Score?

The t score or t statistic is used in a t test when you are trying to either support or reject the null hypothesis. If you think about it, you can actually see some similarities with the z score. After all, you need to find a cut off point, find your t score, and then compare the two. You use the t statistic when you have a small sample size, or if you don’t know the population standard deviation.
One of the main ideas to keep in mind about the t score is that it doesn’t tell you much on its own; it needs to be put in some context. So, with this in mind, you need to actually get more information by taking a sample and running a hypothesis test.
Check out everything you need to understand and use the standard normal table.
Z Score Vs T Score: Understanding The Difference

So, now that we showed you a simplified version of what the z score and the t score are, you are probably wondering about when you should use one or the other.
As a rule of thumb, you should use the t score whenever you have a sample size below 30, and when you have an unknown population standard deviation. On the other hand, whenever you have a sample size that is 30 or more and you know the standard deviation of the population, then you need to use the z score.