Predictive Analytics: What Is It And Real Life Examples
Simply put, predictive analytics is the way that you have to predict any future event based on past behavior. The truth is that predictive analytics is a combination of both statistics and data mining. Therefore, the tools that predictive analytics uses come from these two areas and they include:
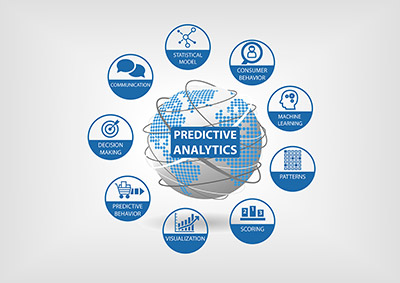
– build models to predict what can happen in the future
– identify trends and patterns
– create visual representations of the information
– generate other useful information.
Check out the best statistics calculators.
The Goals Of Predictive Analytics
While predictive analytics has many different goals, one of the most important ones is to assign a predictive score (or probability) for the likelihood that a specific organizational unit such as a component, a vehicle or a customer, will behave in a specific way.
Let’s say, for example, that you are a manufacturer and you are trying to determine the probability of a customer to buy a second product. In this case, you would use predictive analytics. Besides this simple example, there are many areas where predictive analytics plays an important role. These include:
– marketing
– travel
– child protection
– actuarial science
– insurance
– telecommunications
– crime prevention
– insurance
– healthcare
– banking and other financial services.
This is how you should conduct a t test in Excel.
One of the things that you need to understand about predictive analytics is that even though it is defined “in the future”, the reality is that it can also be used to analyze past and present behavior. For example, predictive analytics can be used to analyze the data collected in a crime scene to generate a profile for the most likely suspects.
Important Areas Where Predictive Analytics Is Used
While predictive analytics can be used in a wide range of fields, the two most important areas include:
#1: Marketing Analytics:
Marketing analytics allows you to determine how a business or company is really performing. So, it uses metrics such as:
– Marketing attribution: Identifies user actions (called “events” or “touchpoints”) that contribute in some manner to a certain outcome.
– Customer lifetime value (CLTV): Predicts how much a customer will buy over time.
– Quarterly or yearly sales forecasts
– Overall marketing effectiveness
– Next best offer or product recommendation: predicts what your customer is most likely to purchase next
– Return on Investment (ROI).
Learn everything you need to know about an unpaired t tat for two samples.
#2: Healthcare Analytics:
Healthcare analytics includes a wide range of data that is generated by healthcare professionals, patients, and healthcare systems. Healthcare analytics can include keeping and analyzing:
– Financial costs such as supply chain, revenue, costs, and insurance reimbursements
– Data on mass customization of care
– Patient wellness management records
– Biometrics usage
– Patient satisfactory surveys.
Check out this paired t test example.
Predictive Analytics Real Life Examples
One of the best real life examples that w can provide you is related to banking. After all, you just need to think about your credit score. Your past behavior will help determine your present and future behavior in terms of the likelihood of making timely payments in the future.
Another example is related to cybersecurity, for example. As you know, this is a growing concern and predictive analytics can be used here as well. After all, real-time analytics examines the network traffic and tries to identify patterns that may indicate computer-software vulnerability or fraud.