3 Designs That Look Like Repeated Measures
When you first hear or read about the repeated measures concept, most statistics students tend to immediately assume that it can be applied to a wide range of situations. However, the truth is that it describes only one situation.
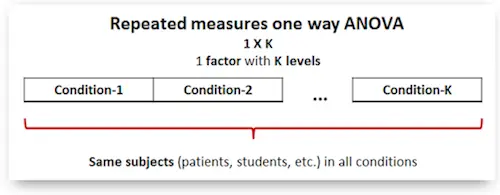
Simply put, a repeated measures design is one where each subject is measured repeatedly over time, space, or condition on the dependent variable. To add to this fact, it is important to keep in mind that these repeated measurements aren’t independent of each other. In fact, they are clustered. Besides, they are more correlated to each other than they are to responses from other subjects. Even if both subjects are in the same condition.

Discover all the stat calculators you need.
So, when you want to get accurate standard errors, p-values, and confidence intervals, then the non-independent clustering needs to be accounted. While this may seem simple, the truth is that it can easily become complicated since the clustering can look very different in different studies. In addition, it is also worth pointing out that some study works look like repeated measures but they’re not.
Repeated Measures – What They Need To Comply With
Ultimately, you have repeated measures only if you have 3 different and important elements:
- Multiple clustered measurements of the dependent variable
- that are more correlated to each other than to others’ measurements because they’re measured on the same subject
- repeatedly over time, space, or condition.
So, when you have a study and you want to determine if it requires a repeated measures analysis, then you need to define these 3 elements. Let’s check some examples:
Make sure to use our standard error calculator.
Example #1: Measuring the graduation rate in 50 high schools in the 4 years before and 4 years after an intervention:
- Multiple clustered measurements of the DV: 8 measures of pass rate per school
- Subject: school
- Repeated over: time
Discover our standard error calculator updated in 2020.
Example #2: Measuring the time it takes second language learners to read a sentence under 4 different grammar structures:
- Multiple correlated measurements of the DV: 4 measures of reading time of each sentence per person
- Subject: Person learning a language who reads the sentences
- Repeated over: grammar structure condition
Studies That Aren’t Repeated Measures
#1: A Single Subject That Is Measured Over Time:

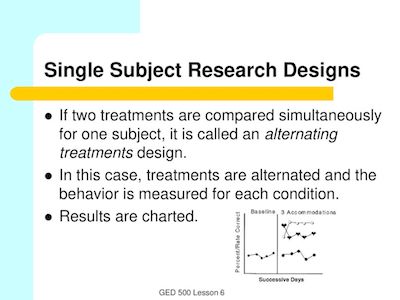
One of the cases where many statistics students tend to assume they can use the repeated measures is when they have a single subject that is measured over time. However, this design is missing the second element. The truth is that the responses from our single subject cannot be more correlated to each other than to other subjects’ responses because there are no other subjects.
Simply put, this is a time series which means that there is a serial autocorrelation (similarities in responses that are closer in time).
Discover how to calculate standard error.
#2: A New Random Sample Of Subjects At Each Time Point:

Another case that many students tend to assume the use of repeated measures is a cross-sectional longitudinal design. For example, you measure the annual revenue of 30 companies for 10 years. But each year you randomly selected a new sample of 30 companies. That’s not repeated measures. With new subjects at each time point, we’re missing element #2.
When you cannot match a subject’s measurement in year 1 to the same subject’s measurement in year 2, that is not repeated measures.
#3: A Predictor Variable Is Measured Repeatedly Over Time For each Subject But The Dependent Variable Is Measured Once:
For example, a study where 30 companies’ revenues over 10 years were used to predict whether or not they had an IPO in year 11.
In this case, it is missing element #1. The repeated measurements have to be on the dependent variable. Since you have only a single measurement of the dependent variable, that’s not repeated measures, even though there are 10 measures of the predictor.