Measures of Predictive Models: Sensitivity and Specificity
When you are studying statistics, you need to keep in mind that accuracy is crucial. However, this is not the only measure that statistical models use. In fact, we can even state that there are many different ways to measure how well a statistical model predicts a binary outcome. The most popular ones are accuracy, sensitivity, and specificity.
Measuring Accuracy Of Model Predictions

The truth is that accuracy in statistical terms is no different than when you look at it from a different point of view. Besides, this is a very basic term that usually doesn’t deliver any kinds of problems in statistics, unlike sensitivity and sensitivity.
However, before we proceed to those, we believe that it is important to understand the 3 first in a situation of predicting a binary outcome.
Let’s imagine that for each trial there is only one possible or true outcome: a positive or a negative. Let’s say that you went to a grocery store and that when you were about to pay the bill with your credit card, it was denied. Let’s assume that the positive is a stolen credit card.
The truth is that to predict the outcome better, you need to use a model to predict. In case your credit card transactions were randomly declined for fraud, you would simply stop using the card.
Check out our z score calculator.
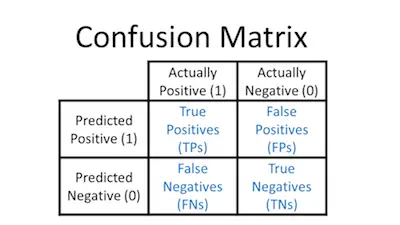
Here’s an example of this model:

The image you see above is called a confusion matrix. However, you can see that it is pretty simple and straightforward.
The Test Indicator simply refers to the process that you’re using to predict whether each individual is a Yes or a No on the outcome that you’re interested in. So, in our example, the question would be id the bank’s model can predict a thief.
The Outcome is what really happens. So, in this case, it would pose the question: was the card stolen?
In what concerns some decisions, those in the box a, the model correctly predicted a No. And here there aren’t any problems. After all, in this case, the customer is using his own credit card and the bank believes him. Now, if you take a look at box b, here is the count of those who were predicted to be Yeses but were actual Nos. And this delivers a False Negative which is not a good option. After all, the customer isn’t happy to see his credit card declined. While a quick call to the bank can fix the problem, it’s not a good situation.
Looking to determine the z score?
On box c you have the opposite situation of b. After all, it refers to those who were predicted to be Nos but were actual Yeses. Again, we have a False Negative.
And, finally, some transactions were predicted to be Yeses and truly were Yeses. These individuals are all in box d. Justice is served.
Accuracy Of Models

As you can easily understand, an accurate model would place all transactions into either boxes a or d. These were the only situations where customers could go ahead and pay for the good and thieves would be stopped.
Now, if you look at boxes b and c, this is really the worst model that you can have. After all, you would end up with angry customers and happy thieves which is just the opposite of what you want.
Make sure to use our online z score calculator.
One simple way of measuring Accuracy is simply the proportion of individuals who were correctly classified–the proportions of True Positives and True Negatives. While this may be helpful, the reality is that you can usually increase one simply by decreasing the other. This may have important implications but the overall Accuracy rate won’t change.
Or worse, we could improve overall Accuracy just by making the test more able to find the more common category.
So a better approach is to look at the accuracy for Positives and Negatives separately. These two values are called Sensitivity and Specificity.