Z-score Calculator
Use this free calculator to generate a Z score. Enter a value, population mean and the standard deviation (for the population).
Please input numbers in the required fields and click CALCULATE.
Before we dig in and explain to you how you can use our z score calculator, we believe that it is always best to start at the beginning. And with this w mean to start by explaining to you some things you need to know about the z score.
What Is A Z Score?
Simply put, a z score is the number of standard deviations from the mean a data point is. The truth is that you can see that this is a much more simple definition of z score than the one that you probably heard in your classroom. However, if you want to put the z score definition in more technical terms, then we can say that the z score is a measure of how many standard deviations above or below the population mean a raw score is.
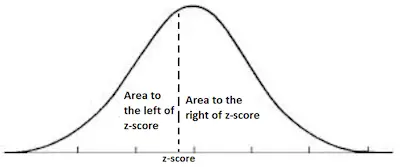
One of the things that you should keep in mind is that sometimes, the z score is also referred to as a standard score. Besides, it is worth to point out that you can place the z score on a normal distribution curve.
Discover how to find a confidence interval.
We can also stat that z scores can range between -3 standard deviations (which are the ons that are located on the left of the normal distribution curve) and +3, which ar the ones that are located on the right of the normal distribution curve.
When you are looking at z scores, this is the same as saying that you are comparing the results from a test to a “normal” population. Notice that w are referring to the results from surveys and tests that can have thousands of possible units or results.
When you are using z scores, it is important that you have something to compare them against or they may be meaningless. For example, there’s no point in knowing that someone’s weight is 150 pounds when you are looking at the weights of numerous people that are recorded in kilograms. A z score will be able to tell you where the person’s weight is compared to the average population’s mean weight.
Now that you have a good grasp about what the z score is and its range, let’s take a look at how to calculate z score.
Using Our Z Score Calculator
When you are trying to do a z score calculation, you can do it by hand but you can also use our simple and free z score calculator that is located at the top of this page.
If you take a quick look at our z value calculator, you can easily see that there are three different variables. While we are going to take a closer look at the z score formula below when you explain to you how to calculate z score by hand, you ned to know that when you want to calculate the z score, you need to know the mean μ as well as the standard deviation σ.
So, if you check our z value calculator, you can see that you will need to fill out three different blanks: the population mean, the population standard deviation, and the value. As soon as you fill out all these values, you just need to click on the Calculate button to get your z score.
Let’s check a practical example so that you can easily understand the entire process. Imagine that you just had a test and you scored 800. And you know that the test results on your classroom hav a mean of μ = 70 and a standard deviation of σ = 6.
So, you want to calculate your z score to know where you are standing compared to the rest of the classroom.
So, you will need to add to the calculator the population mean which, in this case is 70, the standard deviation which in this case is 6, and the value for which you want to calculate the z score which in this case is 800.
As soon as you click on the Calculate button, you will know that you z score is 121.66667.
As you can see, it is very easy to use our z score calculator when you want to calculate the z score. Besides, this calculator can also be very useful to confirm your results.
Looking to know more about the F statistic?
The Z Score Formulas
As we already mentioned, when you are trying to do a z score calculation, you need to know both the mean μ as well as the population standard deviation σ. Besides, you need to understand that depending if you have one sample or multiple samples, the z score formula that you need to use is different.
#1: The Z Score Formula – One Sample:
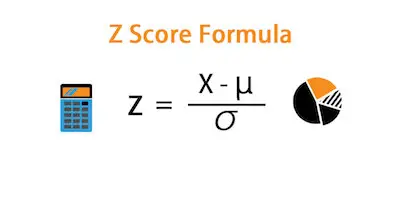
When you just have one sample, the z score formula is as follows:
So, let’s say that you just has a test score of 200. Besides, you know that the test had a mean of (μ) of 130 and a standard deviation (σ) of 30. Assuming a normal distribution, your z score would be:
z = (x – μ) / σ
z = (200 – 130) / 30
z = 70 / 30
z = 2.33
As we already saw, the z score tells you how many standard deviations from the mean your score is. So, we can say that in this specific example, your score is 2.33 standard deviations above the mean.
Why you need to understand the P value.
#2: The Z Score Formula – Multiple Samples:
When you need to deal with multiple samples and you want to describe the standard deviation of those samples, then you need to use a different z score formula. In this case, the formula will be as follows:
z = (x – μ) / (σ / √n)
It is worth to point out that this z score will tell you how many standard errors there are between the sample mean and the population mean.
Here is a quick example so that you can understand how you should use this formula. Let’s imagine that the mean height of women is 68” with a standard deviation of 2.8″.
So, what is the probability of finding a random sample of 60 women with a mean height of 71″, assuming the heights are normally distributed?
So, in this case, since you have multiple samples, you will need to use the following z score formula:
z = (x – μ) / (σ / √n)
By replacing the numbers that you got:
z = (71 – 68) / (2.8/√60)
z = 3 / 0.3615
z = 8.3
Since we also know that 99% of values tend to fall within 3 standard deviations from the mean in a normal probability distribution. So, we can then state that there us less than a 1% probability that any sample of women will have a mean height of 71”.
Learn more about the normality tests for statistical analysis.
How To Calculate Z Score – Practical Examples
The truth is that while you may understand all the concepts involved in the z score calculation, we believe that practicing is one of the best ways to consolidate those concepts. So, let’s take a look at two more practical examples.
Practical Example #1: The grades on a history midterm at your school have a mean of μ=85 and a standard deviation of σ=2.
You scored 868 on the exam. Find the z-score for Michael’s exam grade.
z = (your grade – mean grade) / standard deviation
z = (86 – 85) / 2
z = 1/2
z = 0.5
Your z-score is 0.50 so, your grade was half of a standard deviation above the mean.
Notice that sometimes you need to round your result. In case you don’t know how to round numbers, you can simply use this rounding calculator.
Practical Example #2: The grades on a geometry midterm at your school have a mean of μ = 82 and a standard deviation of σ = 4.
You scored 747474 on the exam. Find the z-score for Michael’s exam grade.
z = (his grade – mean grade) / standard deviation
z = (74 – 82) / 4
z = -8/4
z = -2
Your z-score is -2 so, your grade was two standard deviations below the mean.
How To Interpret A Z Score
While it is important that you understand and know how to calculate the z score, it is also important that you know how to interpret the value that you get.
As we already mentioned above, the value of the z score tells you how many standard deviations you are away from the mean. So, taking this into consideration, we can then say that:
- If you get a z score equal to 0, then it is on the mean
- If you get a positive z score, then this indicates that the raw score is higher than the mean average. So, if you have, for example, a z score that is equal to +1, you can say that it is 1 standard deviation above the mean.
- If you get a negative z score, then this indicates that the raw score id below the mean average. So, if you have, for example, a z score that is equal to -2, you can say that it is 2 standard deviations below the mean.
However, there is a different way that you have to interpret the z score values that you get. As we already mentioned above, you can place the z score on a normal distribution curve. This curve is also referred to as the probability distribution or the z score distribution as well.
The Normal Distribution Curve
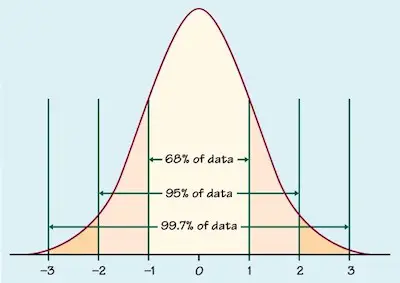
When we are talking about the normal distribution curve, there are some aspects that you ned to keep in mind:
- The normal distribution curve has always the same shape as the raw score distribution. For example, in case you have a distribution of raw scores that is normally distributes, then you can assume that the normal distribution curve will also be normally distributed.
- The mean of any normal distribution curve is always zero.
- The standard deviation of any normal distribution curve is always 1. So, we can then say that one standard deviation of the raw score always converts into 1 z score unit.
As you can easily understand, the normal distribution curve allows you to always calculate te probability of randomly obtain a score from the distribution or sample. For example, we can say that
- There is a 68% probability of randomly selecting a score between -1 and +1 standard deviations from the mean.
- The probability of randomly selecting a score between -1.96 and +1.96 standard deviations from the mean is 95%.
- If there is less than a 5% chance of a raw score being selected randomly, then this is a statistically significant result.
Learn everything you need to know about the normal distribution.
Real World Problems Using The Z Score
One of the questions that many students have is concerned to how they will apply the z score calculation in the real life. However, we can say that the z score calculation is very used when you need to compare the results of a survey or a test that you did with the overall results. Without this comparison, you won’t have any idea about where you are standing comparing to others. And this can be very useful in many areas of life.
Discover more about the z score and its applications.
Bottom Line
As you can see, it is not difficult to understand the z score value or the way that it is calculated. Hopefully, you were able to fully understand can you can make this calculation by hand as well as how you can interpret the results. Besides, you can also use our simple and free z score calculator to confirm your results.