Analysis Of Variance Explained
Analysis of variance which is more commonly called ANOVA, is just a statistical method that is designed to compare means of different samples.
Simply put, it’s a very easy way to compare how different samples in an experiment differ from one another if they differ at all. It is similar to a t-test except that ANOVA is generally used to compare more than two samples.

Discover everything you need to know about statistics.
As you probably already know, each time you do a t-test, you actually compound the error. This means that the error gets larger for every test you do. So, what starts as a 5% error for one test can turn into a 14% error for 3 tests!
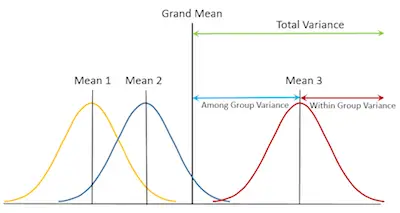
ANOVA is a method that takes these little details into account by comparing the samples not only to each other but also to an overall Grand Mean, Sum of Squares (SS), and Mean Square (s2). It also compares error rates within the groups and between the groups. ANOVA tests the hypothesis that the means of different samples are either different from each other or the population.
The Details

When you use ANOVA, you are testing whether a null hypothesis is true, just like regular hypothesis testing. The difference is that the null hypothesis states that the means of each group are equal. You would state it something like X1 = X2 = X3. ANOVA would tell you that one or all of them are not equal.
You also need to keep in mind that ANOVA relies on the F-distribution. Simply put, the F-distribution compares how much variance there is in the groups to how much variance there is between the groups.
If the null hypothesis is true, then the variances would be about equal, though we use an F-table of critical values in a similar way to a t-test to determine if the values are similar enough.
Analysis of variance compares means, but to compare them all to each other we need to calculate a Grand Mean.
The Grand Mean, GM, is the mean of all the scores. It doesn’t matter what group they belong to, we need a total mean for comparison.
Understanding the basics of principal component analysis.

The Sum of Squares, SS, is what you get when you add up all the squared standard deviations. We use this value to calculate the Mean Square of Treatment, MStreat, which is the sum of squares divided by the degrees of freedom in the sample (N – number of groups). It tells you the amount of variability between the groups.
The final detail that we are going to talk about is the Error Sum of Squares, SSerror, which refers to the overall variance of the samples.
Remember that variance tells you how precise your data is. SSerror is used to calculate the Mean Error Sum of Squares, MSerror. This basically tells us the variability of the data in the group.
An introduction to probability and statistics.
Bottom Line
As you can see, the analysis of variance doesn’t ned to be hard. It just takes a bit more time and a bit more effort from your part.