Category : ANOVA

Analysis Of Variance Explained

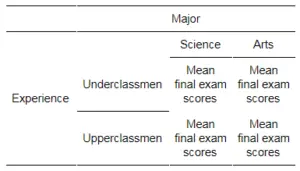
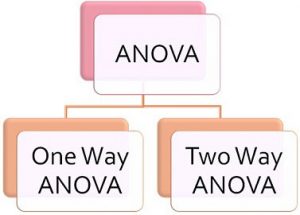
Analysis of variance which is more commonly called ANOVA, is just a statistical method that is designed to compare means of different samples. 

Simply put, it’s a very easy way to compare how different samples in an experiment differ from one another if they differ at all. It is similar to a t-test except that ANOVA is generally used to compare more than two samples.

analysis-of-variance

Discover everything you need to know about statistics.

As you probably already know, each time you do a t-test, you actually compound the error. This means that the error gets larger for every test you do. So, what starts as a 5% error for one test can turn into a 14% error for 3 tests! 

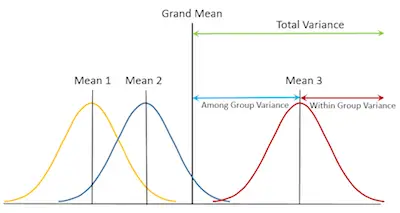
ANOVA is a method that takes these little details into account by comparing the samples not only to each other but also to an overall Grand Mean, Sum of Squares (SS), and Mean Square (s2). It also compares error rates within the groups and between the groups. ANOVA tests the hypothesis that the means of different samples are either different from each other or the population.

The Details

ANOVA

When you use ANOVA, you are testing whether a null hypothesis is true, just like regular hypothesis testing. The difference is that the null hypothesis states that the means of each group are equal. You would state it something like X1 = X2 = X3. ANOVA would tell you that one or all of them are not equal.

What is partial correlation?

You also need to keep in mind that ANOVA relies on the F-distribution. Simply put, the F-distribution compares how much variance there is in the groups to how much variance there is between the groups. 

If the null hypothesis is true, then the variances would be about equal, though we use an F-table of critical values in a similar way to a t-test to determine if the values are similar enough.

Analysis of variance compares means, but to compare them all to each other we need to calculate a Grand Mean. 

The Grand Mean, GM, is the mean of all the scores. It doesn’t matter what group they belong to, we need a total mean for comparison.

Understanding the basics of principal component analysis.

analysis-of-variance-details

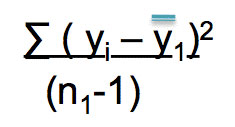
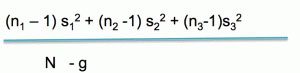
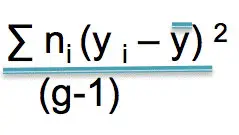
The Sum of Squares, SS, is what you get when you add up all the squared standard deviations. We use this value to calculate the Mean Square of Treatment, MStreat, which is the sum of squares divided by the degrees of freedom in the sample (N – number of groups). It tells you the amount of variability between the groups.

The final detail that we are going to talk about is the Error Sum of Squares, SSerror, which refers to the overall variance of the samples. 

Remember that variance tells you how precise your data is. SSerror is used to calculate the Mean Error Sum of Squares, MSerror. This basically tells us the variability of the data in the group.

An introduction to probability and statistics.

Bottom Line

As you can see, the analysis of variance doesn’t ned to be hard. It just takes a bit more time and a bit more effort from your part. 


Factorial Design Basics For Statistics

When you are doing experiments with both physical and social sciences, one of the standards is that you use a random controlled experiment with just one dependent variable. However, there is a limitation to this design: it overlooks the effects that multiple variables can have with each other. 

When this occurs, you can use one of the most popular factorial design basics for statistics – the factorial design analysis of variance which is also known as the factorial ANOVA. 

Discover the best online statistics calculators.

A Simple Example

Let’s say that you just finished a college class in statistics and the final exam has gotten everyone talking about which majors do best – science or arts. At this moment, the class is mixed between art and science majors and underclassmen and upperclassmen. So, you decide to analyze the means of the final exam scores to figure out who is the best.

Learn more about confidence intervals.

The Main Idea Behind Factorial Design Basics For Statistics

If you remember the simple example we mentioned above, you have 2 variables that have an effect over the outcome: major and college experience, and each has two levels in it. So, this means that there are two independent variables and one dependent variable (final exam scores). 

Factorial design was born to handle this kind of design. Besides, the factorial ANOVA compares groups that may interact with one another. Instead of comparing two groups (majors and experience), you are actually comparing 4 groups:

factorial design basics for statistics

Here you have an example of 2 x 2 factorial design ANOVA. This means that there are two factors that we consider independent variables with two levels of treatment each. So, there will be four groups based on the combination of these factors.

Just like ANOVA, you will compare the means using the variances of each group and group level. However, you cannot simply do a series of ANOVAs because that would introduce too much error to confidently say there is a significant difference. So, you should only look for the main effects of each independent variable and how they potentially interact.

Discover how to interpret the F-test of overall significance in regression analysis.

Main Effects And Interactions

One of the best things about factorial analysis is the fact that it allows us to distinguish between main effects and potential interactions in the groups.

In one-way ANOVA, the main effect is present when the groups within a factor demonstrate a significant difference from the grand mean. In our example, the main effect would be a significant difference between upper and underclassmen or a difference between the arts and the sciences. 

An interaction is present when the dependent variable of the group is affected by a combination of both factors. In our example, a possible interaction would be between underclassmen status and being a science major. This would mean that there is a significant difference between this group and the others. 

Learn why adding values on a scale may lead to measurement error.

Looking At The Visual Differences

Getting back to our example, we will have two lines: the red one which represents the arts majors, and the blue one which represents the science majors.

first visual difference

In the example above, you can see that the lines are close and almost parallel. This means that there is most likely no significant difference between majors, between college experience, and no interaction.

second visual difference

This example indicates that there is a main effect. We know this because, even though the lines are still approximately parallel, the mean final exam scores represent a difference. There is no interaction in this diagram.

third visual difference

Now we have an example of an interaction. The lines are no longer parallel, so there is something going on between the two factors. This is an example of both a main effect and an interaction. You know there is a main effect because the mean final exam scores are different between under and upperclassmen. Since the lines cross (or would if we extend them) there is an interaction between major and college experience.


All You Need To Know About The ANOVA F Value

Simply put, the ANOVA (or analysis of variance) can help you determine if the means of 3 or more groups are different. In order to do this, ANOVA uses the F tests to test if the means are equal or not.

Before we start with the ANOVA F value explanation, we need to ensure that you know everything that you need about the F statistic. The F statistic is simply the ratio of two variances. As you already know, variances are a mean of dispersion. So, this means that variances measure how far the data are scattered from the mean. Ultimately, the larger the values, the larger the dispersion you will have.

Use the statistic tables you need.

anova-f-value

One of the things that you need to know about F tests is that they are very helpful and flexible. After all, you can use them in a wide variety of situations. You can use the F tests and the F statistics not only to test the equality of means but also to test specific regression terms, to compare the fits of different models, and even to test the overall significance for a regression model.

Why Using ANOVA F Value And Not A T Test?

When you have a lot of data, making a t test can be virtually impossible because they won’t provide you with accurate results. Just imagine that you want to make a t test for 4 different groups. So, you will end up with 8 pairwise comparisons. You need to compare group 1 with groups 2, 3, and 4. Then, you need to compare group 2 with groups 4 and 5, and so on. Even though you may think you have a 5% probability of a type I error, the truth is that you need to consider that you are dealing with 8 different pairwise comparisons. So, you just can’t expect them all to be significant.

If you need to calculate the t-statistic, use our T-Statistics and degrees of freedom calculator. 


So, what can you do? The best chance that you have is to use the ANOVA F value.

Let’s imagine that you want to compare the heights of different children who have adopted a regular dit and other children who have adopted a vegan diet. So, now that the children are 13 years all, you decide to measure their heights.

The first thing that you need to think about is on the null hypothesis. With the ANOVA F value, the null hypothesis is that the means are all the same. So, μ1 = μ2 = μ3.

Learn how to calculate the standard deviation.

Now, it’s time to do the F test. In statistics, the F statistic formula is the following one:

F Statistics = variance between groups / variance within groups

In the case that it is proved that the null hypothesis is correct, these two variances should be very similar and you should end up with an F statistic value near 1.

Calculating Variance Within Groups

One of the questions that many people have is related to the way that you have to calculate the variance within groups. If this is also your case, the formula is very straightforward:

within-group-variance-formula

This calculation should be done for each one of the groups individually. However, you need to consider that not all groups are created the same way. So, you will need to weight these group variances using the degrees of freedom for each group. As you know, the degrees of freedom are equal to the total of the sample data minus 1.

So, you should get to a formula like the following one:

within-group-variance-weightened

Calculating Variance Between Groups

In order to calculate the variance between groups, you need to use the following formula:

Variance-Between-Groups-formula

Here are the steps that you need to take:

#1:  Subtract the mean of each group by the overall mean and square the result.

#2: Multiply the result you got by the number in each group.

#3: Add the result.

#4: Divide the result by the number of groups that you have minus 1.