Category : F Distribution

Understanding The F Distribution

When you need to determine if the pattern you identify in your data is significantly different from no pattern at all, you can do this in many different ways. However, the one that is most common is using probability functions. 

Discover all the calculators you need for statistics.

The truth is that probability functions allow you to determine the chance that your model is different. While there are also many probability functions, the F distribution is certainly the one that should be at the top of your list. 

What Is The F Distribution?

Simply put, a probability distribution is a way that you have to determine the probability of a set of events occurring and this is true for the F distribution as well. 

The F-distribution is a skewed distribution of probabilities similar to a chi-squared distribution. The main difference is that the F distribution deals with multiple levels of events having different degrees of freedom. This means that there are several versions of the F-distribution for differing levels of degrees of freedom.

F-distribution

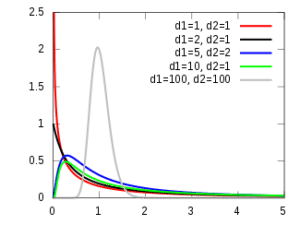
Each curve you see above represents different degrees of freedom. So, this shows you that the area required for the test to be significant is different. 

Make sure to use our critical F-value calculator.

When Should You Use The F Distribution?

The truth is that it’s quite unlikely that you need to build the actual curve by yourself since any statistical software can do it for you. Yet, you need to ensure that you use the curve concept in some experimental setups. 

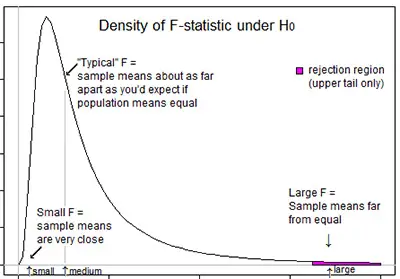
As you probably already know, the F-test, which uses the distribution, compares multiple levels of independent variables with multiple groups. This is what you can easily find in ANOVA and factorial ANOVA. 

Imagine that you are testing a new drug called X and you want to determine the significant effects of different dosages. So, you decide to set trials of 0 mg, 50 mg, and 100 mg of X in three randomly selected groups of 30 each. This is a case for ANOVA, which uses the F distribution.

What is logistic regression?

How To Use The F Distribution

As you probably already assumed, the F distribution is used for the F test. As you know, the F test involves calculating an F-score based on the variances of the 3 levels that you are testing compared to the sample size. The actual F-score is calculated using the following equation:

How-To-Use-The-F-Distribution

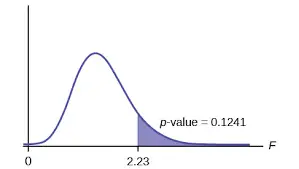
To determine if this value is high enough to be significant, you need to compare it to an F distribution table like this one:

F-distribution-table

You basically find the value at which your degrees of freedom intersect. If your calculated value is higher than the value in the table, then your samples are significantly different. If the calculated value is lower, then the groups are not different enough to be significant.

Learn how to perform a heteroskedasticity test.

Bottom Line

As you can see, the F distribution is a fairly simple concept that can be extremely useful in statistics. Now, you can easily determine the F score as well as use the F distribution table to withdraw your conclusions. 


A Better Understanding About The F Statistic

When you are learning statistics, you will need to understand what the F Statistics is and what it is used for. So, let’s get started with the F Statistics definition.

What Is The F Statistic?

F-statistic

Simply put, the F statistic is the value that you get when you do a regression analysis or you run the ANOVA test to try to find out if the mean between two populations ate significantly different. 

Discover everything you need to know about statistics.

The truth is that the F statistic is very similar to the T statistic. After all, while the T test will allow you to know if a single variable is statistically significant, the F test will allow you to determine if a group of variables is jointly significant. 

What Is “Statistically Significant”?

Statistically-Significant

One of the questions that we keep getting, especially from statistics students, is about what means to be statistically significant. In case you also have the same question, let us clear that for you.

Simply put, when you have a significant result, this means that your results likely didn’t happen by chance. On the other hand, when you don’t have a statistically significant result, this means that you can’t get to a real result. So, this means that you can’t reject the null hypothesis. 

Use our calculator to determine the critical F value.

Using The F Statistic

When you are looking to either support or reject the null hypothesis, you need to determine the F statistics. One of the things that you need to know is that in your F test results, you will have an F critical value and an F value. 

Notice that the F critical value is also known as the F statistic and that the value that you determine from your data is called F value. 

learning-statistics

Looking to calculate the critical F value?

Overall speaking, when your F value in a test is larger than your F statistic, this means that you can reject the null hypothesis. However, you need to keep in mind that the statistic is only one measure of significance in an F test. This means that you also need to determine the p value. Simply put, the p value is determined by the F statistic and is the probability that your results may have happened by chance. 

The F Statistic And The P Value

As we have just shown you, it is very frequent to use the p value combined with the F statistic when you are trying to determine if your results are significant. This is because if you have a significant result, it just doesn’t mean that all your variables are significant. The reality is that the statistic is simply comparing the joint effect of all the variables together. 

F-test

Discover how to easily determine your F critical value.

Let’s say that you are using the F statistic in regression analysis. This may occur because there was a change in the coefficient of determination or a change in the R squared. So, in this case, you will need to use the p value to get the “big picture”. 

In case you get a p value that is less than the alpha value, which is usually considered 0.05, you should proceed with the test. On the other hand, when the p value is more than 0.05, this means that your results aren’t significant and therefore, you can’t reject the null hypothesis. 

Ultimately, you will need to study the individual p values to determine which ones of the variables you are studying are statistically significant.