In case you are studying statistics, at some point, you will cross with the principal component analysis concept.
Discover the best stat calculators online.
Simply put, principal component analysis is just a statistical technique that allows you to do the same thing with data. So, you will be able to try to find which items fo together because they are the result of something you can’t observe directly. For example, imagine that you’re taking a walk in a forest and you see a pile of laves there. The principal component analysis allows you to figure out which leaves come from which tree. So, to do this, you will need to look at the leaves and see which ones are similar and then look for the tree that went with them.
Factors
Factors are just the underlying perceptions or concepts that you can’t directly observe. However, you can observe their effects on different surveys and tests.
Here’s a simple example. You have no idea about how other teachers engage their students in a class since you can’t observe them directly. However, you can design a survey for teachers made of items that represent what research says engagement should like in a class.
Check out our student t value calculator.
Imagine that you made a survey with 20 questions and that the factor you want to measure is student engagement. The survey items represent the effect of engagement. In a scientific sense, you can think of the factor as an independent variable and the items as a dependent variable.
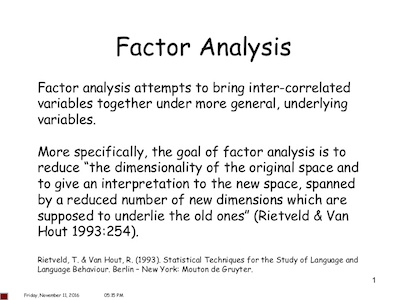
Factor Analysis
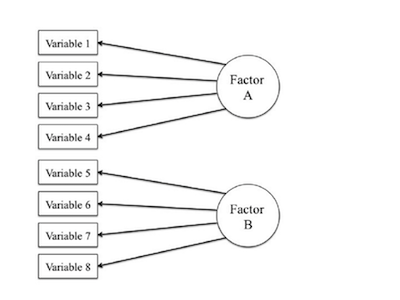
As you can easily understand factor analysis is a technique that looks for correlation between items. In case you had a survey of 6 items, the correlations might look like this:
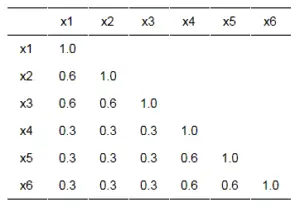
Notice that items x1 – x3 have high correlations with each other while x4 – x6 have high correlations with each other but not x1 – x3. Logically, items x1 – x3 are related and x4 – x6 are related. This means that there are two separate concepts that the items are measuring. Those concepts are the factors.
Looking for an effect size (Cohen’s d) for a student t-test calculator?
However, a simple factor analysis does not take some things into account such as the covariance of the items.
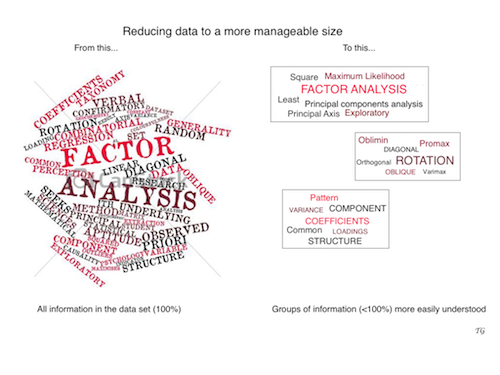
Principal Component Analysis
Simply put, principal component analysis is a more robust and mature version of factor analysis. As you can easily assume, this type of analysis doesn’t only look for correlations of the items but it also looks at correlations between the variance of the items.
Discover our z-score calculator.
The reality is that the variance between the items helps explain how the items are related. For example, if x1 and x4 have a low covariance, then changes in x1 do not explain the changes in x4 very well.
As you can easily understand, principal component analysis has an advantage over traditional factor analysis because it takes into account that the variable may explain each other and how well they do that. If the variances are related, then it makes sense that the items are related.