Category : Heteroscedasticity

How To Perform A Heteroskedasticity Test

If statistics were perfect (as you sometimes see on your statistics books), all your data would always follow a nice straight line and you would never have any errors. However, as you already know, in the real world, things just don’t go that way. The truth is that data can be all over the place and follow a rhyme or reason we didn’t predict. This is the reason why you need to look for patterns in the data using test-statistics and regressions. 
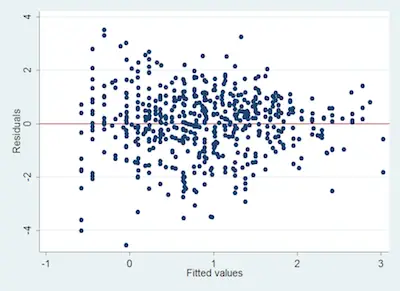
heteroskedasticity-test

You can find the best statistics calculators at StatCalculators.

As you can easily understand, to use those statistics, you usually need to meet the assumption that your data is homoskedastic. This means that the variance of the error term is consistent across all measures of the model. Besides, it also means that the data is not heteroskedastic. 

How To Perform A Heteroskedasticity Test

There are a couple of ways to test for heteroskedasticity. So, let’s check a couple of them:

#1: Visual Test:

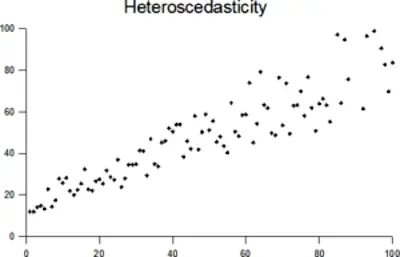
The easiest way to do a heteroskedasticity test is to simply get a good look at your data. Ideally, you generally want your data to follow a pattern of a line, but sometimes it doesn’t. So, the quickest way to identify heteroskedastic data is to see the shape that the plotted data take. 

Don’t know how to perform a simple regression analysis?

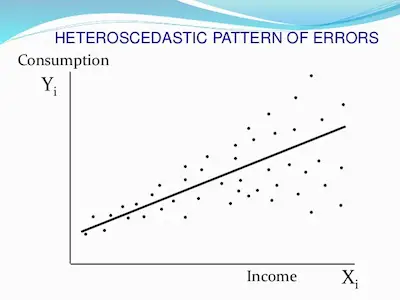
Just check the image below that follows a general heteroskedastic pattern because it is cone-shaped:
general-heteroskedastic-pattern

Since the variance varies, you shouldn’t perform a normal type of linear regression.

#2: Breusch-Pagan Test:
Breusch-Pagan-Test-1

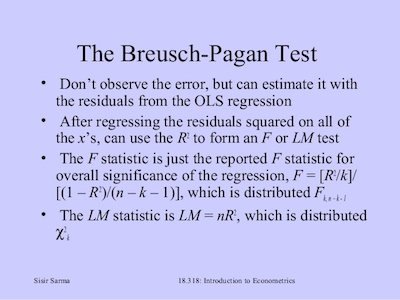
The Breusch-Pagan test is another way you have to do a heteroskedasticity test. The truth is that math is very straightforward:

χ2 = n · R2 · k

Where,

  • n is the sample size
  • R2 is the coefficient of determination based on a possible linear regression
  • k represents the number of independent variables. 

The degrees of freedom are based on the number of independent variables instead of the sample size. This test is interpreted as a normal chi-squared test. 

When you get a significant result, this means that the data is heteroskedastic. Notice, however, that if the data is not normally distributed, then the Breusch-Pagan test may give you a false result. 

Learn how to deal with missing data in statistics.

#3: White’s Test:
White-Test

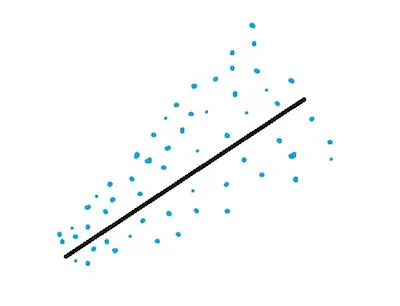
There’s no question that the White’s test is the most robust test when you are performing a heteroskedasticity test. The reality is that it tests whether all the variances are equal across your data if it is not normally distributed. Notice that the math may be a bit complicated but you can certainly use a statistic software to calculate it for you. 

The White’s test is interpreted the same way as a chi-square test. If the test is significant, then the data is heteroskedastic. Besides, it still determines whether the variance is all equal across the data. However, the test is very general and can sometimes give false negatives.

Learn how to interpret regression coefficients.

Bottom Line

One of the most important things to keep in mind is that determining the heteroskedasticity of your data is essential for determining if you can run typical regression models on your data. Besides, there are 3 main tests you can perform to determine the heteroscedasticity.
What Is Heteroscedasticity?

Heteroscedasticity, which can also be spelled heteroskedasticity, is crucial when you are trying to interpret many things including linear regression. So, today, we decided to take a closer look at heteroscedasticity and see what it is and how you can use it. 

heteroscedasticity

Discover everything you need to know about statistics.

What Is Heteroscedasticity?

Simply put, heteroscedasticity is just the extent to which the variance of residuals depends on the predictor variable. 

If you remember, the variance refers to the difference between the actual outcome and the outcome that was predicted by your model. Besides, in case you don’t know or simply don’t remember, residuals can be different from the model as well. 

We can then say that the data is heteroskedastic when the amount that the residuals vary from the model changes as the predictor variable changes. 

The truth is that many statistics students deal with some difficulties when looking at these definitions and concepts as they are. So, there is nothing like checking an example so you can fully understand what heteroscedasticity is. 

Finally understand the significance level.

Heteroscedasticity – An Example

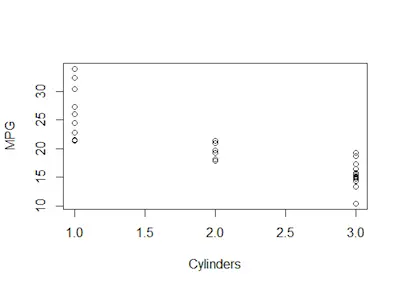
Imagine that you are shopping for a car. One of the most important things people want to know before they buy a new car is the gas mileage. So, with this mind, you decide to make a comparison between the number of engine cylinders to the gas mileage. And you end up with the following graph:

Heteroscedasticity-Graph

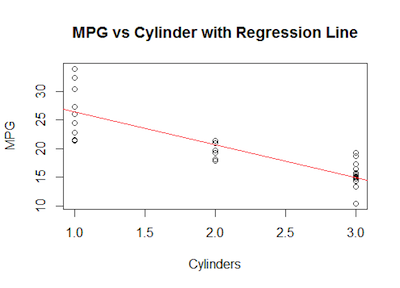
As you can see, there is a general downward pattern. However, at the same time, you can also see that the data points seem to be a bit scattered. It is possible to fit a line of best fit to the data. But there it misses a lot of the data.

Gas-Milleage

If you pay attention to the image above, you can see that the data points are pretty spread out at first. But when you look at the data closer, you see that it spreads out again. This represents heteroscedastic data. So, this means that your linear model doesn’t fit the data very well, so you need to probably adjust it. 

Discover the OLS assumptions.

Why Do You Need To Care With Heteroscedasticity?

The main reason why heteroscedasticity is important is that it represents data that is influenced by something that you are not accounting for. So, as you can understand, this means that you may need to revise your model since there is something else going on. 

Overall speaking, you can check for heteroscedasticity when you compare the data points to the x-axis. When you see that it spreads out, this shows you that the variability of the residuals (and therefore the model) depends on the value of the independent variable. But this is not good for your model. After all, it also violates one of the assumptions of linear regression.

So, whenever this occurs, you need to rethink your model. 

Looking to know more about factorial design basics for statistics?

Special Notes

One of the things that many people don’t know is the fact that if the data can be heteroscedastic, it may also be homoscedastic as well. 

Simply put, homoscedastic data is when the variability of the residuals don’t vary as the independent variable does. So, if your data are homoscedastic, that is a good thing. It means that your model accounts for the variables pretty well so you should keep it.

One common misconception about hetero- and homo-scedasticity is that it has to do with the variables themselves. But it only has to do with the residuals.