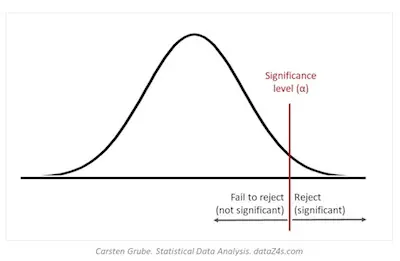
Understanding The Significance Level
When talking and learning about statistics, you probably already know that significance is paramount to come up with a viable model that explains patterns in your data. So, we can then say that the significance level is the level at which we are willing to accept the chance as an explanation.
Check out the best statistics calculators online.
Before we proceed to talk a bit more about the significance level, we want to ensure that we are on the same page. So, summing up, when you are doing statistical analysis, you need to develop a hypothesis about patterns in your data. You will then use those methods to determine a model of the data that fits the hypothesis. According to what you already know, the null hypothesis is that the model does not fit the data very well while the hypothesis is the model itself.
So, when you reject the null hypothesis, this means that you are accepting the hypothesis as true with a specific degree of confidence. That degree of confidence represents the significance level of the model.
Learn more about the binomial distribution.
What Does Significance Mean?
Generally, in statistics, we are willing to accept that level of chance. After all, it is very low that I chanced upon the right order. This also means that I am 95% sure that I did not simply guess correctly and I can taste the difference.
So, put another way, the significance level is the amount to which we are willing to attribute our results to chance.
This is the difference between descriptive and inferential statistics.
Why Significance Levels Are Almost Always 5%? Can’t They Be 0%?
The significance level that most statisticians are willing to accept is 5% or a probability of 0.05. Sometimes, they select a significance level of 0.01 or 0.001. The lower level of chance you accept, the more likely you are to reject the null hypothesis correctly.
But why not just select 0% chance?
In this case, this would mean that there was no error at all, and this is just not feasible over hundreds or thousands of trials. There is always an infinitesimally small chance always present in any experiment or study due to error.
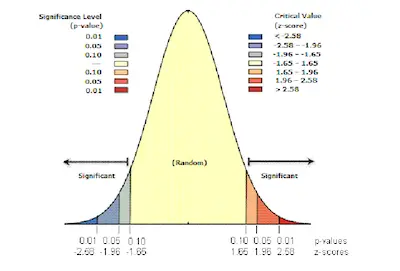
Also, the smaller degree of chance that we are willing to accept increases the chance that we reject or retain the null hypothesis falsely. This is called Type I Error. To compensate, researchers usually accept a small amount of chance at the 5%, 1%, or 0.1% levels.
Learn how to interpret regression coefficients.
Conclusion
As you can see, it’s not difficult to understand the significance level concept. After all, and mathematically speaking, the significance level refers to the probability of getting that event or model by change. Conceptually, the significance level is the degree of confidence that we have in retaining or rejecting our hypothesis of the difference between the model and random chance. 5% is usually the highest significance level that statisticians and researchers are willing to accept, though it can be less.