In statistics, you have to find a way to figure out where a data point or set falls in. So, you need to use measures of position.
Make sure to check out the best online stats calculators.
The reality is that as soon as you know where a data set or model is, you can figure out what to do with it. So, how can you find out where data is and what it means?
Measures Of Position Explained
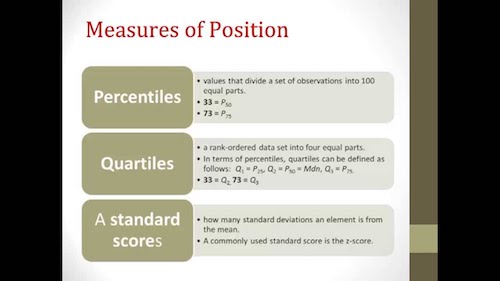
#1: Percentiles:
There’s no question that percentiles are common measures of position.
To get a percentile, the data is divided into 100 regions. A specific data point will fall in one of those regions and then you assign a percentile to indicate how much data is below that specific data point.
Here’s an example. Let’s say that you took your child to the doctor and they measured her height. Once they had her height, they compared it to the national average. In the case of your child, she is in about the 50% of the national data. This means that she is taller than 50% of girls her age. This means that she is above average.
This is the best online z-score calculator.
As you can see, percentiles are a good way to express the measure of position for large datasets. Many national assessments, such as height and ACT scores, use percentiles as a way to convey where specific scores fall because they are easily interpreted.
#2: Quartiles:
Simply put, quartiles divide the data into four regions. The first region comprises the lowest point in the data to the median of the lower half of the data. The second quartile region is from the median of the lower half of the data to the median of the entire data set. The third region makes up the data from the median of the entire data set to the median of the upper half of the data. The final region is made up of the data from the median of the upper half to the greatest data point.

The key region is known as the interquartile range and it represents the middle 50% of the data. Knowing which quartile a datum falls in gives you a sense of how different the data is. Besides, it is also a get way to identify outliers, the points that are excessively high or low.
Check out the 5 steps for calculating sample size.
#3: Z-Scores:
If there is something you need to know about a-scores is that they’re the most amazing way to identify how a data point differs from the mean.
Simply put, a z-score is a measure of how much the datum or model differs from a standardized mean. Once you calculate a z-score, you can then determine whether it is different enough to be significant. A z-score is calculated as follows:
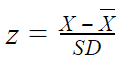
Since is in terms of standard deviations, it is possible to determine the significant difference.
A quick understanding about factor analysis and how big your sample needs to be.
For example, a datum of a model with a z-score of ± 1.2 means that the datum differs from the mean by 1.2 standard deviations. If the z-score is ± 2.6, then the datum or model is 2.6 standard deviations from the mean. This means that the datum or model is statistically from the mean and represents a significant result.