Category : P Value

Understanding The P Value

The P value is very used in statistics. Simply put, the P value is the level of marginal significance within a specific statistical hypothesis test that represents the probability of a specific event to occur. 

The P value tends to be used as a different test to reject points. This way, the P value is able to provide the smallest level of significance at where the null hypothesis can be rejected. 

P-value

Make sure that you use the best statistical calculators online for free.

The smaller the P value is, the stronger is the evidence in favor of the alternative hypothesis. 

Calculating The P value

In order to calculate the P value, you need to use the P value tables or a statistical software. 

calculating-the-P-value

One of the things that you should keep in mind is that not all researchers use the same levels of significance. So, this means that when you are examining a question, you may have some difficulties comparing the results from two different tests. So, what researchers usually do is that they tend to include the P value directly on the hypothesis test. This allows you to know and interpret the statistical significance on your own. This is often referred to as the P value approach to hypothesis testing. 

Discover everything you need to know about the ANOVA F value.

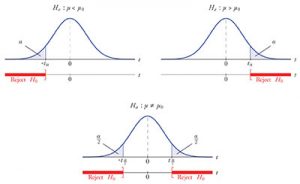
P Value Approach To Hypothesis Testing

limitations-of-the-P-value

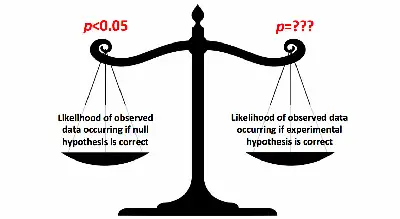
When you are looking to determine the P value this way, you will need to use the calculated probability in order to calculate if there is any evidence that allows you to reject the null hypothesis. Just as a side note, the null hypothesis is the initial claim that you make about a population of statistics. 

Then, you have the alternative hypothesis. This alternative hypothesis should state if the population parameter is different from the value of the population parameter that you established on the null hypothesis.  

Take a look at this reliable tool for Chi Square test.
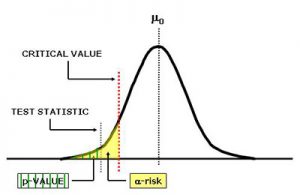
The Type I Error

reading-the-P-value

Many times, when you are reading about the P value approach to hypothesis testing you will see the mention to a type I error. 

Simply put, the type I error is the false rejection of the null hypothesis. You need to understand that the probability of a type I error to occur or to reject the null hypothesis when this one is true is similar to the critical value or P value that you used. On the other hand, the probability of accepting the null hypothesis when this one is true is similar to 1 minus the critical value or P value. 

Discover what range means in math.

Quick Facts About The P value

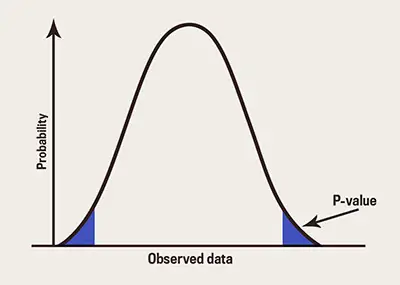
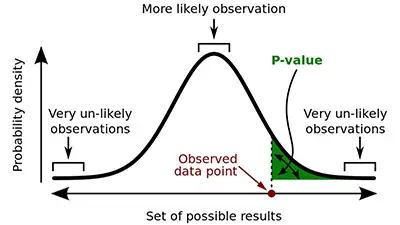
– When you are doing a statistical hypothesis test, the P value is the level of marginal significance that represents the probability of a specific event to occur.

– In order to determine or calculate the P value, you need to use either a statistical software or the P value tables.

– When you have a P value that is small, this means that there is a strong evidence of the alternative hypothesis to be accepted. 


Learn How To Calculate P Value From Z By Hand

While there are many online calculators that show you how to calculate p value from z, the truth is that it is important to understand how to make this calculation by hand.

Before we actually start with the explanation about how to calculate p value from z, it is important that you know that when you are testing a hypothesis about a specific population, you can and should use the test statistic to decide if you will reject the null hypothesis, H0. And this can be made when you already know the p value.

Make sure to check the best free statistic calculators online.

The p value is always a probability and it is linked to your critical value. On the other hand, this critical value depends on the probability of a Type I error to occur. So, what we are saying is that it measures the probability of achieving results that are at least as strong as yours if the null hypothesis (H0) is true.

how-to-calculate-p-value-from-z

It is important to notice that in case the alternative hypothesis is the less-than alternative, in this case, you will only be able to reject the null hypothesis (H0) if your test statistic hits the left side of the distribution.

So, how to calculate p value from z?

The first thing you need to do to calculate the p value from z is to check your test statistic on the appropriate distribution – on the Z-table.

Check our Z score table. 

Now, looking at the Z-table, you will need to find the probability of where Z is more extreme than your test statistic. You will then be able to take one of the three possible conclusions:

#1: When Ha Contains A Less-Than Alternative:

critical-value-and-test-statistic

You will need to determine the probability that Z is less than your test statistic. As a side note, it is important to mention that this test statistic is usually negative.

#2: When Ha Contains A Greater-Than Alternative:

You will need to determine the probability that Z is greater than your test statistic. So, you’ll need to search for the value in the Z-table and then subtract it from one. As a side note, it is important to mention that this test statistic is usually positive.

Learn how to find Z score for a normally distributed data.

#3: When Ha Contains A Non-Equal-To Alternative:

distribution-plot-example

In this case, you will need to find the probability that Z is not only beyond your test statistic as you will need to double it. When this situation occurs, there can be two different scenarios:

– When your test statistic is positive, you will need to first check the test statistic on the Z-table where the Z probability is greater than your test statistic, and subtract it from one and, only then, you will double the result to get the p value.

– When your test statistic is negative,  you will need to first check the test statistic on the Z-table where the Z probability is less than your test statistic and you will double it to get the p value.