Category : Standard Deviation

Standard Error Of Mean Vs Standard Deviation

When you are learning statistics, two of the first concepts that you will need to understand are the standard error of mean and the standard deviation. However, many students tend to confuse both. So, to prevent this from happening to you, we decided to tell you a bit more about each one of these concepts as well as show you the differences between them. 

Discover the best statistic calculators online.

Standard Error Of Mean Vs Standard Deviation

standard error of mean

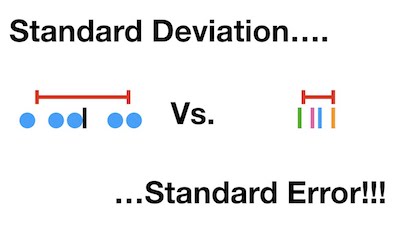
Simply put, the standard deviation measures the amount of dispersion or variability for a specific set of data from the mean. On the other hand, the standard error of mean measures how far the sample mean of the data is likely to be from the true population mean. 

One of the things that you should keep in mind is that the standard error of mean is always smaller than the standard deviation. 

Check out our standard error calculator.

When They Are Both Used

Notice that in some instances, researchers can use both the standard error of mean and the standard deviation. This occurs, for example, in some clinical experimental studies. 

In these particular cases, both the standard error of mean and the standard deviation are used to display the characteristics of the sample data as well as they both serve to explain the statistical analysis results. 

Standard Error Of Mean Vs Standard Deviation

Discover how to easily determine the standard error with our calculator. 

A very important aspect to consider is that there are many researchers who tend to use both concepts as if they were the same. This is especially the case os studies related to medical literature. So, it is very important that these researchers keep in mind that the standard error of mean and the standard deviation are two different concepts. As we already explained above, the standard deviation is the dispersion of the data in a normal distribution. This simply means that this measure indicates how accurately the mean actually represents the sample data. On the other hand, the standard error of mean includes statistical inference that is based on the sampling distribution. 

Calculating Standard Error Of Mean

calculating standard error of the mean​

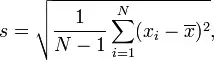
As you can see, when you need to calculate the standard error of mean, you need to take the standard deviation and divide it by the square root of the sample size. 

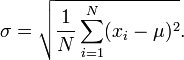
If you take a closer look at the standard deviation formula, then it is easy to understand that you need to follow some steps:

#1: Take the square of the difference between each data point and the sample mean, finding the sum of those values.

#2: Now, divide that sum by the sample size minus one, which is the variance.

#3: Finally, take the square root of the variance to get the SD.

Confirm your results with our simple standard error calculator.

Bottom Line

Simply put, the standard error of mean is just an estimate of how far the sample mean is likely to be from the population mean, whereas the standard deviation of the sample is the degree to which individuals within the sample differ from the sample mean. 

So, if the population standard deviation is finite, the standard error of the mean of the sample will tend to zero with increasing sample size, because the estimate of the population mean will improve, while the standard deviation of the sample will tend to approximate the population standard deviation as the sample size increases.


How To Calculate Standard Deviation Step By Step

Before we start by showing you how to calculate standard deviation, it is important to know exactly what the standard variation is.

What Is Standard Deviation In Statistics?

Simply put, the standard deviation in statistics is a measure of dispersion or variation between values in a specific set of data. It is usually represented by σ.

One of the thing that you need to understand is that the lower the standard deviation, the closer the data points will be to the mean or expected value, which is represented by μ. On the other hand, the higher the standard deviation, the wider is the range of the values.

The reality is that the standard deviation is used for many different things as we will see later on. Besides expressing population variability, the standard deviation is also used many times to determine the margin of error, for example. When you need to calculate standard deviation for this purpose, it is often referred to as standard error of the mean.

Find all the statistics calculators that you need.

Population Standard Deviation And Sample Standard Deviation

When we are talking about standard deviation, it is important to distinguish between population standard deviation and sample standard deviation.

  • Population Standard Deviation:

This kind of standard deviation is used when an entire population can be measured. In this case, you need to use the following formula:

calculate-standard-deviation

Where:

– xi is an individual value

– μ is the mean/expected value

– N is the total number of values

  • Sample Standard Deviation

In some cases, it isn’t just possible to measure the entire population. So, you just can’t use the formula above.

When this happens, you will be forced to use a sample of the population that you need to study. While there are many different formulas to determine the sample standard deviation, we use the corrected sample standard deviation that is usually referred to as s.

sample-standard-deviation-formula

Where

– xi is one sample value

– x̄ is the sample mean

– N is the sample size

Why Do You Need To Calculate Standard Deviation?

While it is not normal that scientists calculate standard deviation manually since it can involve a lot of work and a lot of time, the truth is that it is important that you know how to do it as well as it is important that you understand what the standard deviation is used for.

The reality is that standard deviation is very used in industrial and experimental settings to test different models against real-world data. One of the areas that you know well and where standard deviation is very used is in product quality control. How?

You can use the standard deviation calculations to determine both a minimum and maximum value of a specific feature of a product. When it falls under or above, respectively, you will need to change it because it doesn’t have enough quality anymore.

However, standard deviation calculations can be used in other areas such as in weather. When you want to determine the differences in regional climate within the country, stand deviation can be quite helpful.

In case you like financials, then you surely will need to calculate standard deviation. After all, it can be very helpful when you need to determine the risk associated with the variations in the price of your asset or portfolio of assets.

There are many other situations that you can analyze by using the standard deviation. These are just some of them.

Calculate Standard Deviation Step By Step

Now that you understand the importance of standard deviation, let’s see how you can calculate it.

As we have already mentioned, this is something that is usually done by software. Nevertheless, we understand that it is important that you know how to calculate everything and each step that allows you to determine the standard deviation.

As you already know, standard deviation tells you how the numbers in your sample spread out.

standard-deviation-chart

Step #1: Find the mean, or average, of your sample.

Let’s say that you have the following data set: 10, 8, 10, 8, 8, and 4

The first thing you need to do before you calculate the mean of your sample is to look at the actual sample that you have. Take a deeper look at the numbers. Are they close to each other or they vary across a large range? What do this numbers represent? After all, you already know that you can use the standard deviation for multiple situations. So, the sample data that you have may refer to weight, height, test scores, heart rate readings, among so many others.

Now, it’s time to calculate the mean of your sample. Simply put, the mean is the average of all your points. Therefore, in order to calculate it, you’ll need to add all the numbers in your sample and then divide them by their total number.

So, according to our example, you have the following sample: 10, 8, 10, 8, 8, and 4

Mean = (10 + 8 + 10 + 8 + 8 + 4) / 6 = 48 / 6 = 8

Confirm your mean results here. 

Step #2: Subtract the mean from each number in the sample.

Now that you already determined the mean of your sample, you will now need to subtract this mean to each one of the numbers of your sample. So, you should end up with:

10 – 8 = 2

8 – 8 = 0

10 – 8 = 2

8 – 8 = 0

8 – 8 = 0

4 – 8 = -4

Step #3: Square all of the products from the previous step.

Since our main goal is to calculate the standard deviation, we need to make sure that we calculate the variance first.

In order to calculate the variance, you will need to square all the numbers that we just found in the previous step. So, this is how you should end up:

2^2 = 4

0^2 = 0

2^2 = 4

0^2 = 0

0^2 = 0

(-4)^2 = 16

Step #4: Add the squared products together.

All that you need to do in this step is to sum up all the values that you calculated in the previous step. So, you’ll end up with:

4 + 0 + 4 + 0 + 0 + 16 = 24

So, your sum of squares is 24.

Step #5: Divide the sum of the squared products by (n-1)

In this step, you will need to divide the sum of the squared products by (n-1). In case you don’t know, n is the number of total numbers that you have in your sample. In our example, we had already determined that we have 6. So, n = 6, where (n-1) = 5.

You also already know that your sum of squares that was determined in the previous step is 24.

So, the variance of your sample is:

Variance = 24 / 5 = 4.8

Step #6: Calculate the square root of the variance to find the standard deviation.

Finally, it’s time to determine the standard variation of your sample.

In order to do it, you just need to use the variance that you determined previously and take the square root of it.

As you still remember, we determined that the variance of our sample was 4.8.

So, in order to determine the standard deviation:

Standard Deviation = √4.8 = 2.19