Mean, Median, Mode, Range Calculator
Use this free calculator to compute the mean, median, mode and range for the given data set. Data sets can contain negative values and fractions.
Please input numbers separated by comma in the required fields and click CALCULATE.
Data set: |
The truth is that when you are taking a math class, you will often hear about the mean, the median, the mode, and the range. You will not only need to know what these are, what is their purpose, as well as you will need to know how to calculate them.
So, whenever you want to save up some time or just confirm your results, make sure that you use our free Mean, Median, Mode, Range Calculator.
How To Use Our Mean, Median, Mode, Range Calculator
One of the best things about our Mean, Median, Mode, Range Calculator is that it is extremely simple to use as well as intuitive. All you need to do is to add your data set to the first field and click on the Calculate button.
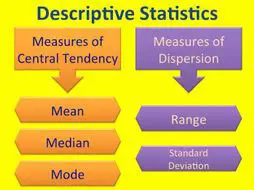
While some other Mean, Median, Mode, Range Calculators only allow you to use integrals, our Mean, Median, Mode, Range Calculator also supports fractions as well as negative values. This ensures that you will be able to use our Mean, Median, Mode, Range Calculator anytime you need to.
The only thing that you need to make sure that you do when you are adding your data set to the field is that you need to add the numbers separated by a comma. That’s it.
As soon as you click on the Calculate button, you will immediately know what is the mean, the mode, the median, and the rang for your specific data set.
Make sure to check out our guide to free calculators.
What Is Mean?
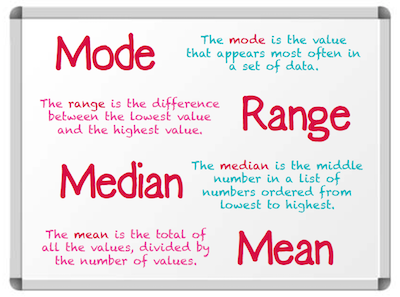
While “mean” can have multiple meanings in our language, when we are talking about the mean in mathematical or statistical terms, we are usually referring to the arithmetic mean or the average.
So, when you are asked to calculate the mean, you will need to find the intermediate value between a discrete set of numbers. So, simply put, in order to find the mean of a specific set of values, you will need to sum them all and then divide its total by the total numbers of values that your data set includes.
This is the formula that is used to calculate the mean:

Where:
– x̄ = mean and is pronounced “x bar”
– N = the total number of values that your data set includes
– x = each one of the values of your data set.
So, let’s check a simple example. Let’s say that you have the following data set:
10, 2, 38,21,23,38,23
And you want to calculate its mean.
x̄ = (10 + 2 + 38 + 21 + 23 + 38 + 23) / 7 = 155 / 7 = 22.143
The mean that we just calculated is one of the most simple math concepts. Nevertheless, it is important that you know that there are other types of means that you can calculate. This includes the geometric mean or the weighted arithmetic mean which gives certain values more weight than others.
One of the things that is important to retain is that when you are using the mean in your statistical calculations, it is important to also look at the median, mode, and range at the same time. When each one of these calculations are looked at independently, they may lead to wrong interpretations.
What Is Median?
The median is another statistical value that is very used. After all, it is the median that will help you divide a probability distribution, a population, or a data sample into two halves.
Simply put, when you are asked to determine the median of a specific data set, you are being asked to determine the value that has a physical location between the rest of the numbers. So, this is why it is important that you have your data set ordered. While it is common to order your values in an ascending order, this is no rule. So, if you prefer to order them in descending order, there shouldn’t be a problem.
The first thing that you will need to determine is if the total number of values in your data set is odd or even. In case it is odd, you won’t have any problems and the median value will be immediately withdrawn. However, when you have an even data set, you will need to take both the numbers that are in the middle and determine their mean.
Let’s say that you have the following data set: 23,13,98,34,65,3,21
And you want to determine the median.
The first thing you need to do is to order the numbers by ascending order. So, you will get:
3,13,21,23,34,65,98
As you can see, the number that stands in the middle is the 23. So, the median of this data set is 23.
Now, let’s take a look at an even data set:
3,13,21,23,31,34,65,98
In this case, you have two numbers in the middle: 23 and 31. So, you will need to calculate their mean:
Mean = (23 + 31) / 2 = 27
The truth is that while both mean and median are useful, the median provides a more insightful knowledge of your data set, especially when you are dealing with large variations between values.
What Is Mode?
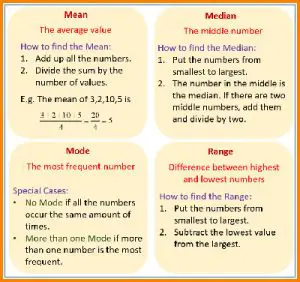
When we are talking about statistics, the mode refers to the value that has more recurrences within your dataset.
Just consider the following data set:
4,7,2,5,4,6
In this case, the mode would be 4 since this is the value that is repeated more than once. All the other numbers are only represented once within the data set.
While mode, just like mean and median allows you to show information about random populations and variables, the mode can also be applied to non-numerical values. Just think about the different brands that sell their chocolate cookies at the supermarket. If you wanted to know which brand is more often purchased, you could use mode.
What Is Range?
The range is one of the simplest calculations that you can make in what concerns to statistics and overall math.
Simply put, the range is simply the difference between the highest value of a data set and the lowest value of the same data set.
Here’s a simple example:
Let’s assume that you have the following data set: 5,8,9,3,1,11, and you want to determine the range.
By looking at the data set, you can easily see that the highest value is 11 and the lowest value is 1. So, the range of this data set will be: 11 – 1 = 10.
Just like mean, the range can also be very affected when there are extremely high or low values within the same data set like what happens in the following data set:
1234,56,45,23,67,88
or in the following one: 34, 6574,6568,2837,9485,3425
When this happens, it may be useful to determine the standard deviation of the data set. Discover how to calculate the standard deviation.
This is why it is always important to analyze your data set before you make any assumptions about the results that you got from calculating the mean, median, mode, and range.
Using Our Mean Median Mode Range Calculator
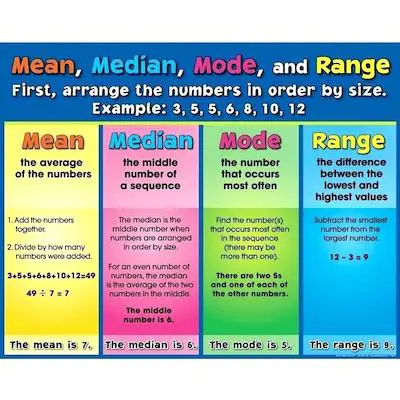
When you are looking to calculate mean median mode and range, you can do it by hand or you can simply use our mean median mode range calculator. After all, and depending on how large your data set is, you may be required to do a lot of calculations. Besides, the error risk definitely increases.
So, no matter if you just want to calculate mean median mode and range or if you are trying to check or confirm your results, you can definitely use our free and easy-to-use mean median mode range calculator.
Discover the best introductory statistics books.
One of the best things about our mean median mode range calculator is that all you need to do is to add your data set separated by commas. As soon as you do this, you just need to click on the Calculate button and you will get the mean, median, mode, and range for that specific data set.
Calculate Mean Median Mode And Range By Hand
So, let’s say that you want to make your calculations by hand and only then, use our mean median mode range calculator to confirm your results.
Let’s check a practical example so that you can fully understand how you can do this.
Practical Example #1: Imagine that you have the following data set: 10, 2, 38, 23, 38, 23, 21.
#1: Determining The Mean:
As you already know, in order to determine the mean, you just need to add all the values of your data set and then divide them by the total number of values that your data set includes. Notice that in this specific case, your data set includes 7 numbers.
Mean = (10 + 2 + 38 + 23 + 38 + 23 + 21) / 7
Mean = 155 / 7
Mean = 22.143
These are the basic statistics for data science you need to know.
#2: Determining The Median:
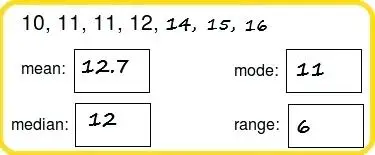
As you already know, the median is a value that divides a data sample, population, or probability distribution into two halves.
In order to calculate the median, you will need to put the values in ascending order and then determine the one that is in the middle. Since in this case, we are dealing with an odd data set, you shouldn’t have any problems figuring out the median.
So, putting the data set in ascending order, you get:
2,10,21,23,23,38,38
As you can easily see, the number 23 in bold is the median of this data set.
#3: Determining The Mode:
In statistics, the mode is the value in a data set that has the highest number of recurrences. It is possible for a data set to be multimodal, meaning that it has more than one mode.
According to the data set that we are using:
2,10,21,23,23,38,38
You can easily see that both 23 and 38 appear twice each, making them both a mode for the data set above.
Take a look at the best statistics books for data science.
#4: Determining The Range:
In statistics, the range of a data set is the difference between the largest and the smallest values. While range does have different meanings within different areas of statistics and mathematics, this is its most basic definition.
Getting back at our data set:
2,10,21,23,23,38,38
Range = 38 – 2
Range = 36
Learn by practicing. Check out these worksheets.
Practical Example #2: Imagine that you have the following data set: 13, 18, 13, 14, 13, 16, 14, 21, 13
#1: Determining The Mean:
As you already know, in order to determine the mean, you just need to add all the values of your data set and then divide them by the total number of values that your data set includes. Notice that in this specific case, your data set includes 9 numbers.
Mean = (13 + 18 + 13 + 14 + 13 + 16 + 14 + 21 + 13) / 9
Mean = 135 / 9
Mean = 15
Learn how to determine a confidence interval.
#2: Determining The Median:
As you already know, the median is a value that divides a data sample, population, or probability distribution into two halves.
In order to calculate the median, you will need to put the values in ascending order and then determine the one that is in the middle. Since in this case, we are dealing with an odd data set, you shouldn’t have any problems figuring out the median.
So, putting the data set in ascending order, you get:
13, 13, 13, 13, 14, 14, 16, 18, 21
As you can easily see, the number 14 in bold is the median of this data set.

#3: Determining The Mode:
In statistics, the mode is the value in a data set that has the highest number of recurrences. It is possible for a data set to be multimodal, meaning that it has more than one mode.
According to the data set that we are using:
13, 18, 13, 14, 13, 16, 14, 21, 13
You can easily see that 13 is the number repeated more often so, it’s the mode for the data set above.
#4: Determining The Range:
In statistics, the range of a data set is the difference between the largest and the smallest values. While range does have different meanings within different areas of statistics and mathematics, this is its most basic definition.
Getting back at our data set:
13, 18, 13, 14, 13, 16, 14, 21, 13
Range = 21 – 13
Range = 8
Learn more about the F statistic.
Bottom Line
As you can see, while it is very easy to calculate mean median mode and range by hand, with larger data sets it can be a bit tricky not to mention that t is also very time consuming. Therefore, a much better option that you have is to simply use our free mean median mode range calculator. This way, you will be saving time, preventing errors and mistakes, and you’ll get all the values you want fast.