While many students tend to struggle in statistics, we believe that the topics aren’t that hard to learn and understand. All it takes is to keep a few concepts in mind and then take a look at different examples so you can see them in practice.
Learn more abou statistics here.
Two of the areas that we believe cause a lot of problems to statistics students are time series analysis and forecasting. However, as you are about to discover, these concepts are simple and easy to understand. Hopefully, at the end of this post, you won’t have any more problems with them.
What Is Time Series?
Simply put, a time series is just a set of data recorded at regular times. Let’s say that you decided to record the outdoor temperature at noon every single day for 1 year. The movement of the data over time may be due to many independent factors:
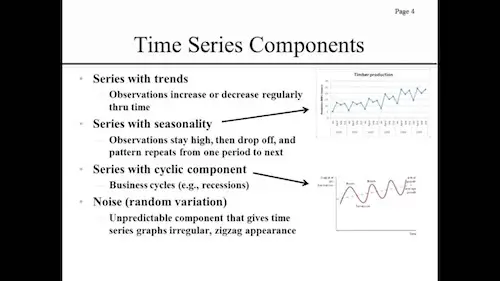
#1: Cyclical Movements:
These cycles can take many years to play out. They include the known business cycles and while some may only take 6 others, others can take half a century.
#2: Long Term Trend:
This is when you are looking at the data as a whole, eliminating the noise or the short-term variations.
#3: Seasonal Variation:
These are predictable patterns of both ups and downs that occur within a single year but they also repeat year after year. Just think of temperatures for example. ou know that in the Spring and Summer they tend to go up as well as they tend to go down in Fall and Winter.
Learn hoe to perform a heteroskedasticity test.
#4: Noise:
All data that you collect has noise. These are the so called random variations or fluctuations due to factors that you cannot control.
Now that you already understand these factors, you need to put them together. The truth is that each factor has an associated data series:
- Trend factor: Tt
- Cyclic factor: Ct
- Seasonal factor: St
- Noise factor: Nt
Finally, the original data series, Yt, consists of the product of the individual factors:
Yt = Tt × Ct × St × Nt
What Is Forecasting?
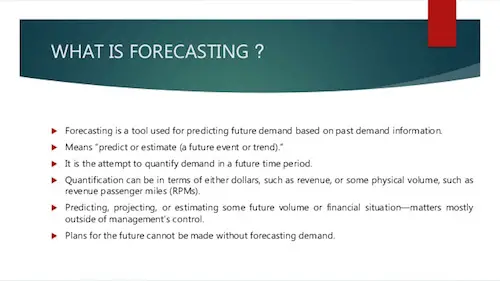
Simply put, when you read forecasting you immediately think of predicting future values of data based on what happened before.
Notice that this is not a perfect science since there are many factors you can control and that may affect the future values substantially. So, the further into the future you want to forecast, the less certain you can be of your prediction.
Understanding the significance level.
If you don’t believe us, just watch the weather reporting and you’ll get a hang of it.
Basically, the theory behind a forecast is as follows:
- Smooth out all of the cyclical, seasonal, and noise components so that only the overall trend remains.
- Find an appropriate regression model for the trend. Simple linear regression often does the trick nicely.
- Estimate the cyclical and seasonal variations of the original data.
- Factor the cyclical and seasonal variations back into the regression model.
- Obtain estimates of error (confidence intervals). The larger the noise factor, the less certain the forecasted data will be.