Descriptive Vs. Inferential Statistics
One of the first things that you study when you begin learning statistics is the descriptive vs inferential statistics difference.
Discover the statistics calculators you need.

The reality is that when you are analyzing data such as the marks achieved by 100 students for a piece of coursework, it is possible to use both descriptive and inferential statistics in your analysis of their marks. But what is descriptive statistics, inferential statistics, and the differences and similarities between the two?
Descriptive Statistics

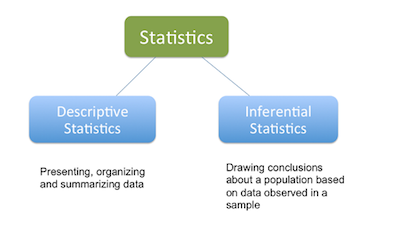
Simply put, descriptive statistics is the analysis of data that helps describe, summarize, or show data in a meaningful way. This way, you can see patterns emerging from the data itself. However, unlike what you may thing, descriptive statistics doesn’t allow you to draw any conclusions beyond the data that you analyzed or reach conclusions regarding any hypotheses you might have made.
Notice that this doesn’t make descriptive statistics less important. In fact, descriptive statistics is important because if you simply presented your raw data, it would be hard to visualize what the data was showing, especially if there was a lot of it.
Learn more about confidence intervals.
For example, if you had the results of 100 pieces of students’ coursework, you may be interested in the overall performance of those students. You would also be interested in the distribution or spread of the marks. And this is exactly what descriptive statistics shows you.
Typically, there are two general types of statistic that are used to describe data:
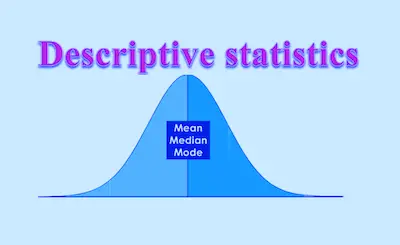
- Measures of central tendency: these are ways of describing the central position of a frequency distribution for a group of data. You can describe this central position using a number of statistics, including the mode, median, and mean.
- Measures of spread: these are ways of summarizing a group of data by describing how spread out the scores are. To describe this spread, a number of statistics are available to us, including the range, quartiles, absolute deviation, variance and standard deviation.
Discover how to interpret the F-test.
Inferential Statistics

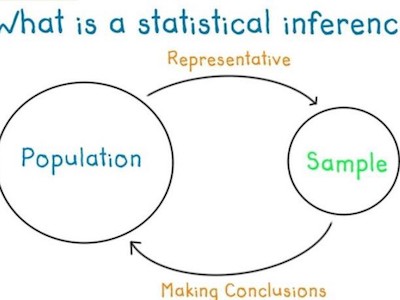
As we just saw above, descriptive analysis allows you to look at a group or part of a population’s data. You can then use different statistics to reach some conclusions. However, in the real world, it is almost impossible to access the whole population data that you are interested in investigating. Therefore, you are limited to a group which means that you will need to use a sample of the population that can represent that same population.
We can then say that inferential statistics are techniques that allow you to use these samples to make generalizations about the populations from which the samples were drawn. The process of achieving this is called sampling. Inferential statistics arise out of the fact that sampling naturally incurs sampling error and thus a sample is not expected to perfectly represent the population. The methods of inferential statistics are the estimation of parameter(s) and testing of statistical hypotheses.
Looking to know why adding values on a scale can lead to measurement error?
Descriptive Vs. Inferential Statistics – Bottom Line

Overall speaking, it is understandable that descriptive statistics are limited. This means that you can only make conclusions about the population that you actually measured.
In the case of inferential statistics, we need to mention that they have 2 limitations. The first one which is also the most important one is the fact that you are providing data about a population that you have not fully measured, and therefore, cannot ever be completely sure that the values/statistics you calculate are correct. The second limitation is the fact that inferential statistics requires the researcher to make educated guesses to run the tests.