How To Interpret The F-Test Of Overall Significance In Regression Analysis
Simply put, the F-test of overall significance tells you whether your linear regression model is a better fit to the data than a model that contains no independent variables. So, today, we decided to take a step further and tale a look at how the F-test of overall significance fits in with other regression statistics, such as R-squared.
Find all the statistics calculators you need here.
In case you don’t know or simply don’t remember, the R-squared tells you how well your model fits the data, and the F-test is related to it.
Understanding The F-Test
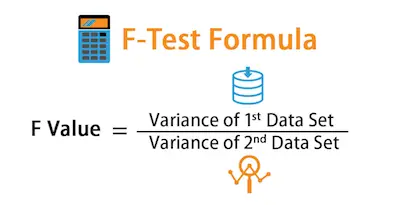
One of the things that statistics students need to keep in mind is that the F-test is a statistical test that is incredibly flexible. This means that you can actually use it in a wide range of settings. One of the main advantages of using the F-test is that it allows you to compare the fits of different linear models which is something that t-tests don’t do.
Check out our F-value calculator.
Calculating The F-Test Of Overall Significance
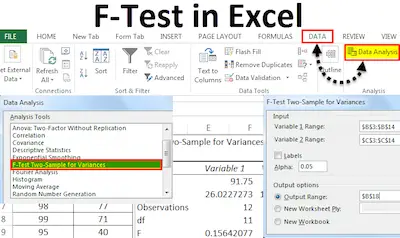
When you need to calculate the F-test of overall significance, you just need to use your statistical software and add the right terms in the 2 models that it compares.
Notice that the overall F-test compares the model that you specify to the model with no independent variables. This type of model is also known as an intercept-only model.
When you need to run the F-test for overall significance, it will have two hypotheses:
- The null hypothesis states that the model with no independent variables fits the data as well as your model.
- The alternative hypothesis says that your model fits the data better than the intercept-only model.
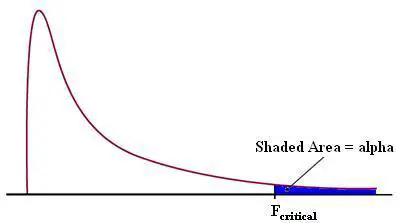
In statistical output, you can find the overall F-test in the ANOVA table.
Understanding a bit more about the F test.
Interpreting The Overall F-Test Of Significance
In order to interpret the results of the test, you will need to compare the p-value for the F-test to your significance level. In case the p-value is inferior to the significance level, this means that your sample data delivers enough evidence to conclude that your regression model fits the data better than the model with no independent variables. In case you are wondering, this is good news. After all, it means that the independent variables in your model improve the fit.
Overall speaking, when none of your independent variables are statistically significant, this means that the overall F-test is also not statistically significant.
In some situations, tests may produce conflicting results. This can occur because the F-test of overall significance assesses all of the coefficients jointly whereas the t-test for each coefficient examines them individually. These conflicting test results can be hard to understand.
Additional Way To Interpret The F-Test Of Overall Significance
It is also important to keep in mind that when you have a statistically significant overall F-test, you can also draw other conclusions.
When you have a model with no independent variables, for example, you can easily conclude that all of the model’s predictions equal the mean of the dependent variable. Therefore, if the overall F-test is statistically significant, your model’s predictions are an improvement over using the mean.