Differences Between Explanatory Models And Predictive Models
As a statistics student or as a researcher, you know that sometimes you are asked to create a specific model. Let’s say that you are asked to create a specific model that predicts who will drop out of college in a specific year. So, you decide to use a binary logistic regression. After all, you know that your outcome will only carry two values: 0 for not dropping and 1 for dropping out.
Learn everything you need to know about statistics.
The truth is that no matter if you are a student or already a researcher, you were trained to build models with the purpose of discovering and understanding the relationships that may exist between an outcome and a set of predictors. However, what you may not know is that model building only works for predictive models. So, how can you solve this situation?
This is what we are about to discover today by looking into explanatory models and predictive models and stating their differences.
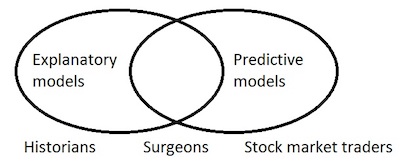
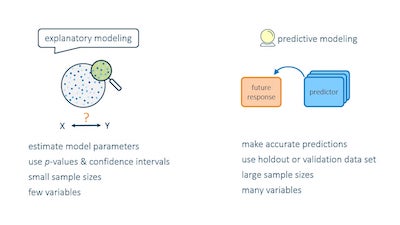
Explanatory Models
When you are using explanatory models, then you understand that you are looking to identify variables that have a scientifically meaningful and statistically significant relationship with an outcome.
So, your main goal is to test the theoretical hypothesis to ensure that there is an emphasis on both theoretically meaningful relationships and determining whether each relationship is statistically significant.
Some of the steps in explanatory models include fitting potentially theoretically important predictors, checking for statistical significance, evaluating effect sizes, and running diagnostics.
Looking for a quick t student calculator?
Predictive Models
When you pick a predictive model, your main goal is different. In this case, your goal is to use the relationships between predictors and the outcome variable to generate good predictions for future outcomes. With this in mind, you can easily understand that predictive models are created in a very different way than explanatory models. After all, in this case, you are looking for predictive accuracy.
Variables that are used in a predictive model are based on association, and not on statistical significance or scientific meaning.
There are times when statistically significant variables will not be included in a predictive model. A significant predictor that adds no predictive benefit is excluded.
Learn how to calculate t value.
If the predictor is significant but only observable immediately before or at the time of the observed outcome, it cannot be used for predictions.
For example, theoretical models have shown that water temperatures are a highly significant factor in determining whether a tropical storm turns into a hurricane. That variable is not useful in a prediction model of the expected number of hurricanes during the upcoming season because it can only be measured immediately before an impending hurricane.
That’s too late.
One of the things to keep in mind when you are using predictive models is that you should always explore. Changing the effect of a continuous predictor by squaring or taking the square root of its value is one approach. The primary limitation for including a predictor in the model is its availability for future model running.
Make sure to use our free student t value calculator.
The primary risk when creating a predictive model is to avoid overfitting which is the result of creating a model that fits the current sample so perfectly that it may not be a good representation of the population. So, how can you decrease this risk?
The best thing to do in this case is to only use half of your data to create your model. Then test your model on the other half.