Everything You Need To Know About Normal Distribution
A normal distribution is one of the most used concepts in statistics. So, what exactly is normal distribution?
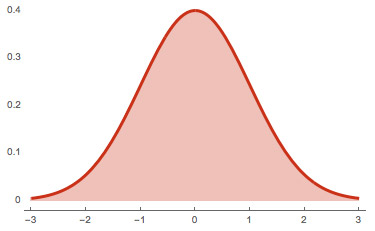
Simply put, a normal distribution is just a distribution that occurs in a natural way in many situations. It is also called the bell curve.

Use the best stats calculators for free.
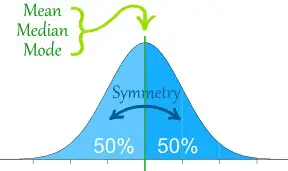
One of the things that you need to keep in mind about the normal distribution is that this curve is symmetrical. This means that half of the data will b on the left of the mean and the other half will be at the right of the mean.
The normal distribution is very used for many different purposes. In fact, it is commonly used in statistics, business, and even in government bodies such as the FDA. It is often used to compare IQ scores, blood pressure, heights of people, salaries, measurement errors, points on a test, among so many others.
These are the basic statistics for data science that you need to know.
Properties Of The Normal Distribution

These are the main normal distribution properties:
– The curve of the normal distribution is symmetric at the center which is around the mean.
– The median, mode, and mean and all equal.
– The total area under the curve is 1.
– Half of the values ate to the right of the center and the other half of the values are to the left of the center.
Standard Normal Model
#1: The Distribution Of Data:
One of the best ways that you have to determine if you have a normal distribution or not is to plot the data in a graph.
When you see that the data is evenly distributed, then you can definitely draw the bell curve or the normal distribution curve.
Looking for the best Data Science statistic books?
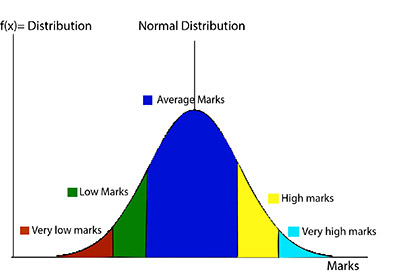
Notice that this curve needs to have a bigger percentage on its inner part and a smaller percentage towards the points on both tails.
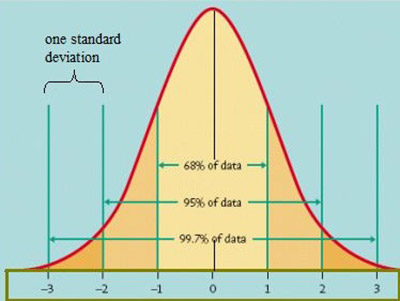
According to the Standard Normal Model, the tails should represent about 5% of your data each while the remaining 90% should be in between.
#2: Practical Applications:
While it is important that you understand normal distribution as well as how it is drawn and formed, the truth is that an example is always a good way to demonstrate a concept.
Let’s imagine that you are trying to discover the subjects that you need to work more to improve your grades. One of the most common mistakes people do is that they assume that when you get a score in one subject that is higher than the score you got on a different subject, they are better in the subject where you got a higher score. While this may be true sometimes, this isn’t always the case.
Learn more about statistical questions.

The truth is that all that you can say when this happens is that you are better is a specific subject if you are able to get a score with a certain number of standard deviations above the mean. If you remember, the standard deviation is able to tell you how your data can or cannot be clustered around the mean.
Let’s say that you just got a score of 90 in Science and 95 in Math. So, you may believe that you need to work harder in Science and that you are better in Math. Nevertheless, you need to know that in Science, your score is 2 standard deviations above the mean. In what concerns to Math, your score is only 1 standard deviation above the mean.

So, with all this information, we can say that your result in Science is far better than your result in Math. After all, your result falls into the tails, being above average.