Factor Analysis – How Big Your Sample Size Needs To Be?
When you are looking to conduct a study, you usually plan a sample size for a data set. This is based on getting reasonable statistical power to ensure that you can run a good analysis. These power calculations figure out how big a sample you need so that a certain width of a confidence interval or p-value will coincide with a scientifically meaningful effect size.
But that’s not the only issue in sample size, and not every statistical analysis uses p-values. One example is factor analysis.
Discover the best stat calculators here.
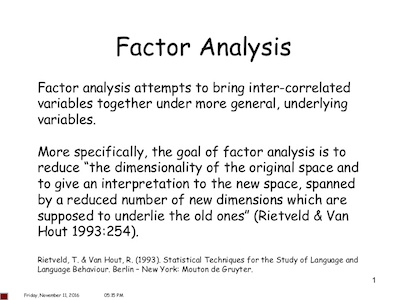
What Is Factor Analysis?
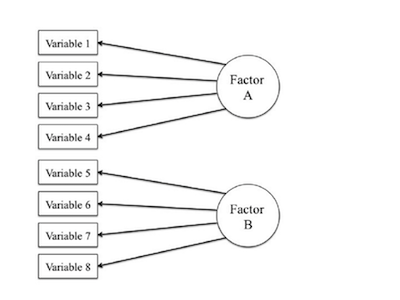
Simply put, factor analysis is a measurement model of an underlying construct. Ultimately, the focus is on understanding the structure of the relationships among variables.
The specific focus in factor analysis is understanding which variables are associated with which latent constructs. The approach is slightly different if you’re running an exploratory or a confirmatory model, but this overall focus is the same.
So, how big does your sample need to be in factor analysis? Simply put, big. However, the answer isn’t that simple in what comes to statistics.
Check out our student t value calculator.
The Rules Of Thumb
The truth is that this is a discussion between authors. For example, some authors use a criterion based on the total sample size:
- 100 subjects = sufficient if clear structure; more is better
- 100 subjects= poor; 300 = good; 1000+ = excellent
- 300 subjects, though fewer works if correlations are high among variables.
Looking for a p-value calculator for a student t-test?
Other authors base it on a ratio of the number of cases to the number of variables involved in the factor analysis:
- 10-15 subjects per variable
- 10 subjects per variable
- 5 subjects per variable or 100 subjects, whichever is larger
- 2 subjects per variable
And then others base it on a ratio of cases to the number of factors:
20 subjects per factor.
Remember That Rules Of Thumb Are Not Rules
While there are rules of thumb in what concerns factor analysis, the reality is that these aren’t rules. Some recent simulation studies have found that the required sample size depends on a number of issues in the data and in the model, working together.
Learn to determine the t statistic and the degrees of freedom with our calculator.
They include all the issues listed above and a few more:
- You’re going to need a large sample. That means in the hundreds of cases. More is better.
- You can get away with fewer observations if the data are well-behaved. If there are no missing data and each variable highly loads on a single factor and not others, you won’t need as many cases. But counting on the data behaving is like counting on the weather behaving during hurricane season. You’ll have a better outcome most of the time if you plan for the worst.
- The main issue with small data sets is overfitting (a secondary issue is if the sample is really small, the model won’t even converge). It’s a simple concept: when a sample is too small, you can get what looks like good results, but you can’t replicate those results in another sample from the same population.
All the parameter estimates are so customized to this particular sample, that they’re not useful for any other sample. This can, and does, happen in any model, not just factor analysis.