A Better Understanding About The F Statistic
When you are learning statistics, you will need to understand what the F Statistics is and what it is used for. So, let’s get started with the F Statistics definition.
What Is The F Statistic?

Simply put, the F statistic is the value that you get when you do a regression analysis or you run the ANOVA test to try to find out if the mean between two populations ate significantly different.
Discover everything you need to know about statistics.
The truth is that the F statistic is very similar to the T statistic. After all, while the T test will allow you to know if a single variable is statistically significant, the F test will allow you to determine if a group of variables is jointly significant.
What Is “Statistically Significant”?

One of the questions that we keep getting, especially from statistics students, is about what means to be statistically significant. In case you also have the same question, let us clear that for you.
Simply put, when you have a significant result, this means that your results likely didn’t happen by chance. On the other hand, when you don’t have a statistically significant result, this means that you can’t get to a real result. So, this means that you can’t reject the null hypothesis.
Use our calculator to determine the critical F value.
Using The F Statistic
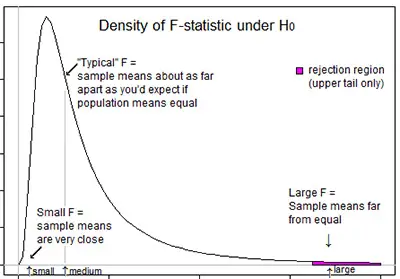
When you are looking to either support or reject the null hypothesis, you need to determine the F statistics. One of the things that you need to know is that in your F test results, you will have an F critical value and an F value.
Notice that the F critical value is also known as the F statistic and that the value that you determine from your data is called F value.

Looking to calculate the critical F value?
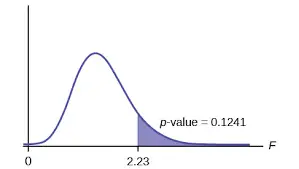
Overall speaking, when your F value in a test is larger than your F statistic, this means that you can reject the null hypothesis. However, you need to keep in mind that the statistic is only one measure of significance in an F test. This means that you also need to determine the p value. Simply put, the p value is determined by the F statistic and is the probability that your results may have happened by chance.
The F Statistic And The P Value
As we have just shown you, it is very frequent to use the p value combined with the F statistic when you are trying to determine if your results are significant. This is because if you have a significant result, it just doesn’t mean that all your variables are significant. The reality is that the statistic is simply comparing the joint effect of all the variables together.

Discover how to easily determine your F critical value.
Let’s say that you are using the F statistic in regression analysis. This may occur because there was a change in the coefficient of determination or a change in the R squared. So, in this case, you will need to use the p value to get the “big picture”.
In case you get a p value that is less than the alpha value, which is usually considered 0.05, you should proceed with the test. On the other hand, when the p value is more than 0.05, this means that your results aren’t significant and therefore, you can’t reject the null hypothesis.
Ultimately, you will need to study the individual p values to determine which ones of the variables you are studying are statistically significant.