OLS (Ordinary Least Squares) Assumptions
One of the first things that you learn about statistics is that there are numerous ways to analyze data. However, as you can easily understand, the way you do it depends not only on what you want to know but also on the data that you actually have.
Discover everything you need to know about statistics.
The reality is that one of the most common wats to analyze data is by using regression models. These types of models estimate patterns in the data using something called ordinary least squares (OLS) regressions. As you probably already know, the OLS (Ordinary Least Squares) needs to meet specific assumptions to be valid.
OLS (Ordinary Least Squares) Assumptions
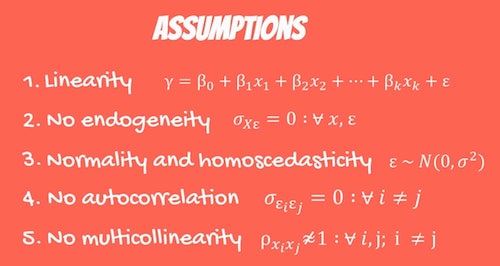
#1: The Linear Regression Model is Linear In Parameters:
Notice that the expression linear in parameters is a bit tricky. The truth is that it only means that the data follow a linear pattern. So, this is a condition of the correlation of the data. Notice that the data doesn’t need to form an exact line. It simply needs to follow either a positive or negative flow for the most part.
Learn more about factorial design basics for statistics.
#2: There Is A Random Sampling Of Observations:
Another important OLS (Ordinary Least Squares) assumptions is the fact that when you want to run a regression, you need to make sure that the sample is drawn randomly from the population. When this doesn’t occur, you are basically running the risk of introducing an unknown factor into your analysis and the model won’t take it into account.
Notice that this assumption also makes it clear that your independent variable causes the dependent variable (in theory). So, simply put, the OLS is a causal statistical method that investigates the ability of the independent variable to predict the dependent variable. This means that you are looking for a causal relationship instead of a correlation.
Discover how to perform a simple regression analysis.
#3: The Conditional Mean Should Be Zero:
This assumption simply means that the average of your error terms for each measurement needs to be zero. This shows that there is no relationship between the independent variable and the errors.
#4: There Is No Multi-Collinearity Or Perfect Collinearity:
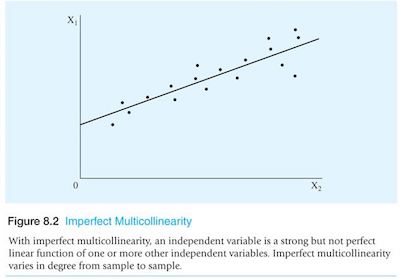
Collinearity means that two or more of your independent variables have a strong correlation with one another. So, when this happens, there is a strong relationship or effect between the two or more variables that you didn’t account for. In this case, your OLS regression can give you a false model.
How to deal with missing data in statistics?
#5: There Is Homoskedasticity And No Autocorrelation:
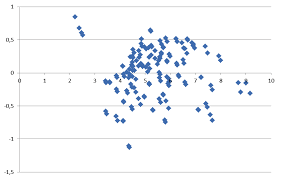
In case you don’t know, heteroskedasticity is a measure of the spherical nature of the data. You can actually see it visually if your data shows the shape of a cone instead of a line.
When your data is heteroskedastic, this means that the variance varies as the data changes. So, since the OLS is based on the variance, you need to ensure that you always have a consistent squared variance and not a changing variance.
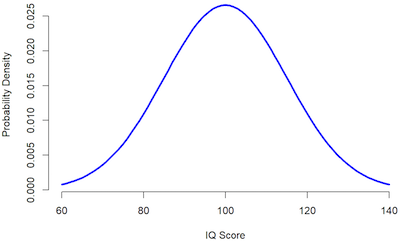
#6: The Error Terms Should Be Normally Distributed:
In case your textbook doesn’t refer to this assumption, it is because it is already covered on the number #3. Nevertheless, we believe that it is important to reinforce it. After all, this means that your errors that are positive cancel out your errors that are negative. This is something that you should check once you have your model.