How To Perform A Simple Regression Analysis
When you have data, most of the time, you should start to analyze it using a graph or some sort of linear regression. However, as soon as you realize, you get an equation. And this is exactly where simple regression analysis comes in.

Discover the best online statistics calculators.
Looking Into The Simple Regression Analysis
Before we take a deeper look at the simple regression analysis, we believe that we should start by reviewing what makes a regression.
The truth is that simple regression analysis simply refers to the interpretation and use of the regression equation. In case you don’t remember, this is how it looks like:
Learn how to deal with missing data in statistics.

The Yi represents the dependent variable in your equation. This refers to the effect or outcome that we are interested in. Xi represents the independent variable and this is the variable that we think predicts the outcome.
In what concerns to the other things, this is where things become more interesting. The b1 represents the actual relationship between the independent and dependent variable. Now, the b0 is more of a theoretical term instead of a practical one. It technically means that when the independent variable is equal to zero, then the dependent variable is equal to b0.
The last part of the equation is εi. This is the error term or the range of wrongness associated with your equation. However, the error term is usually combined with b0 to make the equation a little easier to use.
Learn more about the binomial distribution.
Simple Regression Analysis

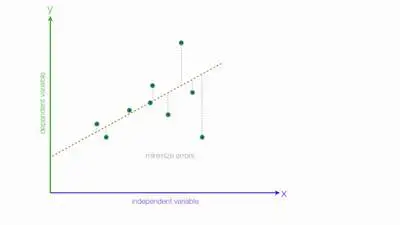
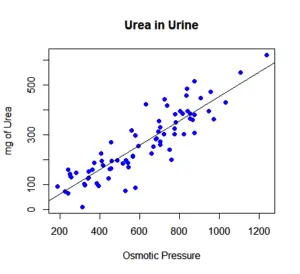
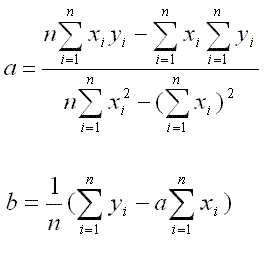
If you take a look at the above graph, you can see a line surrounded by a lot of dots. Each dot represents a data point with an independent variable and a dependent variable. So, using the equation

You can come up with just a line that ends up representing the data.
One of the things that you need to keep in mind is that this line isn’t a perfect fit for the data. Nevertheless, it is still a good prediction. And this is exactly what the regression analysis does: it predicts a dependent based on the independent variable.
Understand the difference between descriptive and inferential statistics.
How Good Is The Prediction?
When you are calculating the regression equation for the data set that you have, you need to ensure that you also calculate the correlation coefficient.
Simply put, the correlation coefficient is a value between -1 and +1 which represents the strength of the regression equation’s ability to predict an outcome.
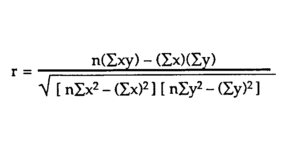
The closer the correlation coefficient is to 1 (either negative or positive), the stronger the relationship, with 1 being a perfect prediction. The formula is:

Notice that the correlation coefficient is different from the coefficient of determination, r2. Simply put, the coefficient of determination is more explanatory since it tells you how much of the variability in the outcome is due to the variability in the predictor.
Overall speaking, a high coefficient of determination means that most of the variance of the model is explained by the independent and dependent variables. On the other hand, a low coefficient of determination means that there is a lot of variance that the model doesn’t explain.