Sampling – The Different Methods & Types
Sampling is crucial in statistics. After all, samples are just parts of a population.
Let’s say that you have information about 100 people out of 10,000 people. The 10 people represent your sample while the 10,000 represents the population. So, you can then use this sample to make some assumptions about the behavior of the entire population.
Check out the top stats calculators online.

While this may seem a very simple process, the truth is that it isn’t. The reality is that you need to come up with a sample that has the right size. It can’t be too big or too small. However, the problems don’t end here. You then need to decide about the technique that you’re going to use to collect the sample from the population.
In order to do this, you have different methods at your disposal:
#1: Probability Sampling:
This sampling process simply uses randomization to select your sample members.
#2: Non-Probability Sampling:
This sampling process isn’t random; it is based on the researcher.
These are the best introductory statistics books.
Sampling Types

The reality is that you have many different sampling types. One of the things that you need to keep in mind is that these may include taking a sample with or without replacement.
Here are some of the most common sampling types that you can use:
#1: Bernoulli Samples:
These include independent Bernoulli trials on the population elements. With these trials, you will be able to determine who belongs to your sample and who doesn’t. However, all elements of the population have the same odds or chances of getting into the sample.
Take a look at the top books for data science.
#2: Cluster Samples:

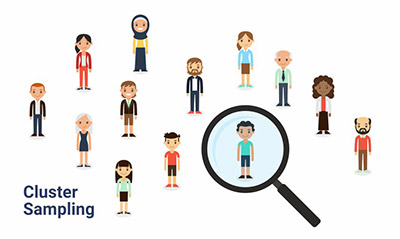
As you can easily imagine by its name, this sampling types divides the population into clusters or groups. After that, you will need to have a random sample chosen from these clusters. This sampling type is usually used when the researcher knows the population groups or subsets but he doesn’t know the individuals in the population.
#3: Systematic Sampling:
In this case, you can choose the sample elements from an ordered frame.
#4: SRS:
With the SRS sampling type, you will choose each one of the elements of your sample completely randomly.
#5: Stratified Sampling:
In this case, you will sample each subpopulation independently.
These are the most common probability math problems.
How To Tell The Difference Between Different Sampling Methods
Step #1:
The first thing you need to do is to discover if the study sampled from individuals. This may show you that this sampling was made using the random method or the systematic sampling method.
Step #2:
You will then need to figure out if the study picked groups of participants. When you have a large number of people, it may be easier to use the simple random sampling.
Step #3:
Determine if the study that you are looking at includes data from more than one defined group. Some real-life examples could be a study about renters and homeowners, democrats and republicans, country folks and city dwellers, among so many others.
Now, just look at the data that you have. When you can see that you have data about the individuals in the groups, you have access to stratified data. So, you will need to perform random sampling. On the other hand, if you see that you only have information about the group in general, then you need to treat it as a cluster sample.
Step #4:
Finally, you will need to know if it was hard or easy to get the sample.