Category : Sampling

5 Steps For Calculating Sample Size

There’s no question that you need to keep many things in mind when you are looking to conduct a study or research. However, one of the most important factors to always consider is related to data especially data size. 

In case you are wondering why this happens, it is fairly easy to understand. After all, undersized studies can’t find real results, and oversized studies find even insubstantial ones. We can then state that both undersized and oversized studies waste time, energy, and money; the former by using resources without finding results, and the latter by using more resources than necessary. Both expose an unnecessary number of participants to experimental risks.

calculating-sample-size

Discover all the statistics calculators you need.

So, the trick is to size a study so that it is just large enough to detect an effect of scientific importance. If your effect turns out to be bigger, so much the better. But first, you need to gather some information about on which to base the estimates.

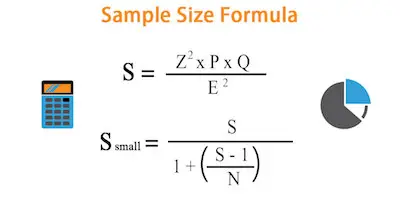
As soon as you’ve gathered that information, you can calculate by hand using a formula found in many textbooks, use one of many specialized software packages, or hand it over to a statistician, depending on the complexity of the analysis. But regardless of which way you or your statistician calculates it, you need to first do 5 steps.

Understanding the 2 problems with mean imputation when data is missing. 

5 Steps For Calculating Sample Size

Calculating-Sample-Size-Steps

Step #1: Determine The Hypothesis Test:

The first step in calculating sample size is to determine the hypothesis test. While most studies have many hypotheses, in what concerns calculating sample size, you should only pick up to 3 main hypotheses. Make them explicit in terms of a null and alternative hypothesis.

Step #2: Specify The Significance Level Of The Test:

While the significance level assumed is, in most cases, 0.5, it doesn’t need to be. 

Understanding measurement invariance and multiple group analysis.

Step #3: Determine The Smallest Effect Size That Is Of Scientific Interest:

For most, this is the most difficult aspect of what concerns calculating sample size. The truth is that the main goal isn’t to specify the effect size that you expect to find or that others have found, but to determine the smallest effect size of scientific interest. This means that you are looking for variables that actually affect the results or outcomes. 

Here are some examples:

  • If your therapy lowered anxiety by 3%, would it actually improve a patient’s life? How big would the drop have to be?
  • If response times to the stimulus in the experimental condition were 40 ms faster than in the control condition, does that mean anything? Is a 40 ms difference meaningful? Is 20? 100?
  • If 4 fewer beetles were found per plant with the treatment than with the control, would that really affect the plant? Can 4 more beetles destroy, or even stunt a plant, or does it require 10? 20?

Check out how cloud computing can benefit data science.

Step #4: Estimate The Values Of Other Parameters Necessary To Compute The Power Function:

sample-size

If you have been studying statistics for some time, then you know that most statistical tests have the format of effect/standard error. 

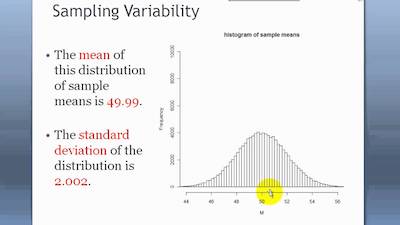
We’ve chosen a value for the effect in step #3. The standard error is generally the standard deviation/n. To solve for n, which is the point of all this, we need a value for standard deviation. 

Step #5: Specify The Intended Power Of The Test:

The final step to calculating sample size is to specify the intended power of the test. 

Simply put, the power of a test is just the probability of finding significance if the alternative hypothesis is true.

As you can understand, a power of 0.8 is the minimum. If it will be difficult to rerun the study or add a few more participants. On the other hand, a power of 0.9 is better. If you are applying for a grant, a power of 0.9 is always better.


Sampling Variability – What Is It And Why It Is Important

In life, you can’t always get what you want, but if you try sometimes, you get what you need. In what concerns to statistics, this is also true. After all, while you may want to know everything about a population or group, in most cases, you will need to deal with approximations of a smaller group. In the end, you need to hope that the answer you get is not that far from the truth. 

sampling-variability

The difference between the truth of the population and the sample is called the sampling variability.

When you are looking for a quick and simple definition for sampling variability, then you can state that it is the extent to which the measures of a sample differ from the measure of the population. However, there are certain details that you need to keep in mind. 

Looking At The Parameters And Statistics

When you are looking at measures that involve a population, you need to know that it is incredibly rare to measure them. For example, you just can’t assume that you can measure the mean height of all Americans. Instead, what you need to do is to take a random selection of Americans and then actually measure their mean height. 

Looking-At-The-Parameters-And-Statistics

Check out our online p-value calculator for a student t test.

Knowing this mean height means that you already have a parameter. So, you can then say that a parameter is just the value that refers to the population like the mean, deviation, among others, that you just don’t know. 

Notice that it is impossible to measure a parameter; what you do have is a possible estimate using statistics. This is why a measure that refers to a sample is called a statistic. A simple example is the average height of a random sample of Americans. As you can easily understand, the parameter of the population never changes because there is only one population. But a statistic changes from sample to sample. 

Looking for a t-statistic and degrees of freedom calculator?

What is Sampling Variability?

If you recall, sampling variability is the main purpose of this blog post. However, we needed to take a look at the previous concepts (statistics and parameters) to ensure that you understand what sampling variability is. 

Simply put, the sampling variability is the difference between the sample statistics and the parameter. 

Whenever you are looking at a measure, you can always assume that there is variability. After all, variability comes from the fact that not every participant in the sample is the same. For example, the average height of American males is 5’10” but I am 6’2″. I vary from the sample mean, so this introduces some variability.

Generally, we refer to the variability as standard deviation or variance.

The Uses Of Sampling Variability

The-Uses-Of-Sampling-Variability

As you can imagine, you can use sampling variability for many different purposes and it can be incredibly helpful in most statistical tests. After all, the sampling variability gives you a sense of different the data are. While you may not be in the average height since you may be taller, the truth is that there are also people who are shorter than the average height. And with sampling variability, you can know the amount of difference between the measured values and the statistic. 

Here’s the best standard deviation calculator.

In case the variability is low, it means that the differences between the measured values and statistics are small, such as the mean. On the other hand, if the variability is high, it means that there are large differences between the measured values and the statistics. 

As you probably already figured out, you are always looking for data that has low variability. 

Sampling variability is used often to determine the structure of data for analysis. For example, principal component analysis analyzes the differences between the sampling variability of specific measures to determine if there is a connection between variables.


Sampling – The Different Methods & Types

Sampling is crucial in statistics. After all, samples are just parts of a population. 

Let’s say that you have information about 100 people out of 10,000 people. The 10 people represent your sample while the 10,000 represents the population. So, you can then use this sample to make some assumptions about the behavior of the entire population. 

Check out the top stats calculators online.

sampling

While this may seem a very simple process, the truth is that it isn’t. The reality is that you need to come up with a sample that has the right size. It can’t be too big or too small. However, the problems don’t end here. You then need to decide about the technique that you’re going to use to collect the sample from the population. 

In order to do this, you have different methods at your disposal:

#1: Probability Sampling: 

This sampling process simply uses randomization to select your sample members. 

#2: Non-Probability Sampling:

This sampling process isn’t random; it is based on the researcher. 

These are the best introductory statistics books.

Sampling Types

random-sampling

The reality is that you have many different sampling types. One of the things that you need to keep in mind is that these may include taking a sample with or without replacement. 

Here are some of the most common sampling types that you can use: 

#1: Bernoulli Samples:

These include independent Bernoulli trials on the population elements. With these trials, you will be able to determine who belongs to your sample and who doesn’t. However, all elements of the population have the same odds or chances of getting into the sample. 

Take a look at the top books for data science.

#2: Cluster Samples:

Cluster-sampling

As you can easily imagine by its name, this sampling types divides the population into clusters or groups. After that, you will need to have a random sample chosen from these clusters. This sampling type is usually used when the researcher knows the population groups or subsets but he doesn’t know the individuals in the population. 

#3: Systematic Sampling:

In this case, you can choose the sample elements from an ordered frame. 

#4: SRS: 

With the SRS sampling type, you will choose each one of the elements of your sample completely randomly. 

#5: Stratified Sampling: 

In this case, you will sample each subpopulation independently. 

These are the most common probability math problems.

How To Tell The Difference Between Different Sampling Methods

Step #1: 

The first thing you need to do is to discover if the study sampled from individuals. This may show you that this sampling was made using the random method or the systematic sampling method. 

Step #2: 

You will then need to figure out if the study picked groups of participants. When you have a large number of people, it may be easier to use the simple random sampling. 

Step #3: 

Determine if the study that you are looking at includes data from more than one defined group. Some real-life examples could be a study about renters and homeowners, democrats and republicans, country folks and city dwellers, among so many others. 

Now, just look at the data that you have. When you can see that you have data about the individuals in the groups, you have access to stratified data. So, you will need to perform random sampling. On the other hand, if you see that you only have information about the group in general, then you need to treat it as a cluster sample.  

Step #4: 

Finally, you will need to know if it was hard or easy to get the sample.