Sampling Variability – What Is It And Why It Is Important
In life, you can’t always get what you want, but if you try sometimes, you get what you need. In what concerns to statistics, this is also true. After all, while you may want to know everything about a population or group, in most cases, you will need to deal with approximations of a smaller group. In the end, you need to hope that the answer you get is not that far from the truth.

The difference between the truth of the population and the sample is called the sampling variability.
When you are looking for a quick and simple definition for sampling variability, then you can state that it is the extent to which the measures of a sample differ from the measure of the population. However, there are certain details that you need to keep in mind.
Looking At The Parameters And Statistics
When you are looking at measures that involve a population, you need to know that it is incredibly rare to measure them. For example, you just can’t assume that you can measure the mean height of all Americans. Instead, what you need to do is to take a random selection of Americans and then actually measure their mean height.

Check out our online p-value calculator for a student t test.
Knowing this mean height means that you already have a parameter. So, you can then say that a parameter is just the value that refers to the population like the mean, deviation, among others, that you just don’t know.
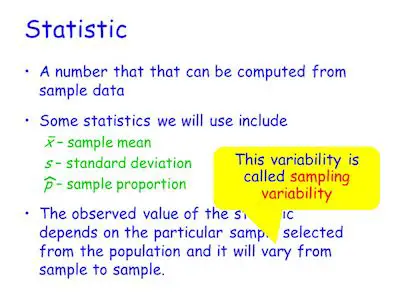
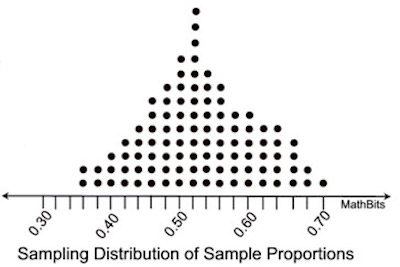
Notice that it is impossible to measure a parameter; what you do have is a possible estimate using statistics. This is why a measure that refers to a sample is called a statistic. A simple example is the average height of a random sample of Americans. As you can easily understand, the parameter of the population never changes because there is only one population. But a statistic changes from sample to sample.
Looking for a t-statistic and degrees of freedom calculator?
What is Sampling Variability?
If you recall, sampling variability is the main purpose of this blog post. However, we needed to take a look at the previous concepts (statistics and parameters) to ensure that you understand what sampling variability is.
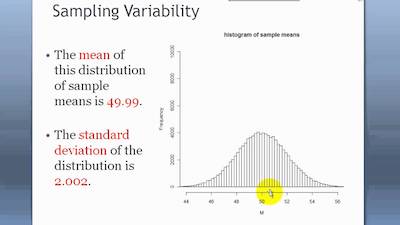
Simply put, the sampling variability is the difference between the sample statistics and the parameter.
Whenever you are looking at a measure, you can always assume that there is variability. After all, variability comes from the fact that not every participant in the sample is the same. For example, the average height of American males is 5’10” but I am 6’2″. I vary from the sample mean, so this introduces some variability.
Generally, we refer to the variability as standard deviation or variance.
The Uses Of Sampling Variability

As you can imagine, you can use sampling variability for many different purposes and it can be incredibly helpful in most statistical tests. After all, the sampling variability gives you a sense of different the data are. While you may not be in the average height since you may be taller, the truth is that there are also people who are shorter than the average height. And with sampling variability, you can know the amount of difference between the measured values and the statistic.
Here’s the best standard deviation calculator.
In case the variability is low, it means that the differences between the measured values and statistics are small, such as the mean. On the other hand, if the variability is high, it means that there are large differences between the measured values and the statistics.
As you probably already figured out, you are always looking for data that has low variability.
Sampling variability is used often to determine the structure of data for analysis. For example, principal component analysis analyzes the differences between the sampling variability of specific measures to determine if there is a connection between variables.